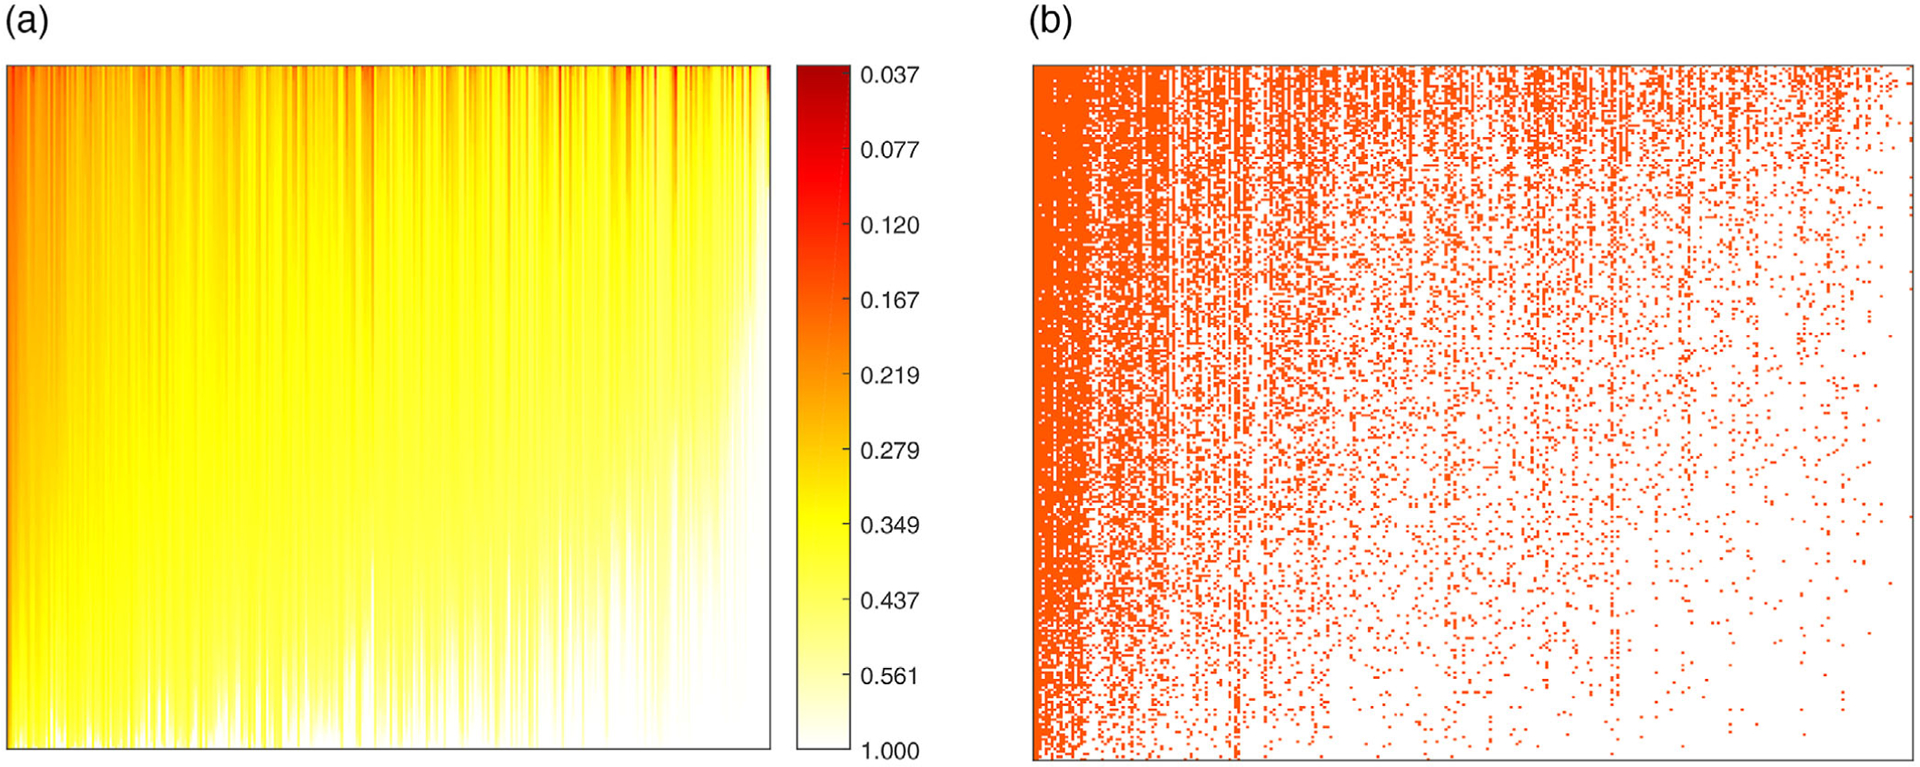
FIGURE 4. Comparison of predicted probability of zeros and real zero distribution in the dataset.

Note. (a) Heatmap of predicted zero probability. (b) Heatmap of the binary real data value. Red points are non-zero values and white points are zeros. Both heatmaps are rearranged in the same row and column ordering. This figure appears in color in the electronic version of this paper, and any mention of color refers to that version.
