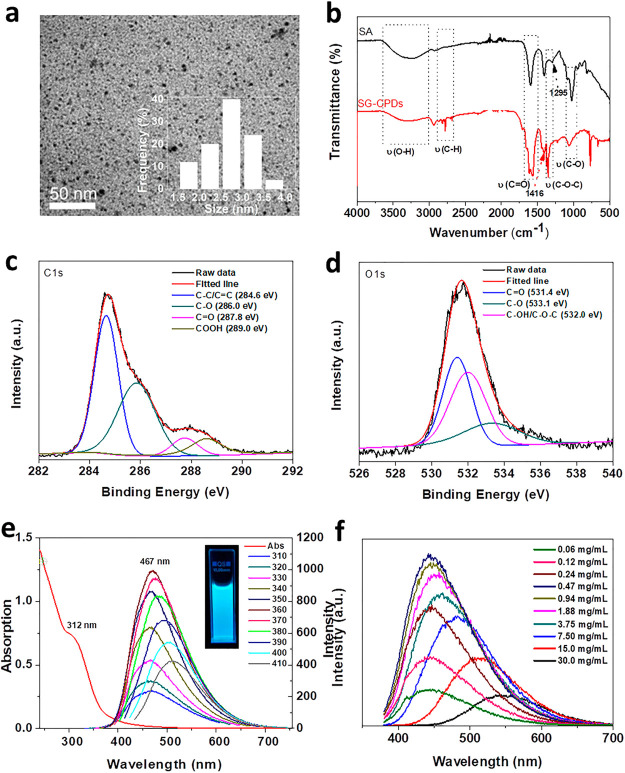
Figure 1.
(a) TEM image of SG-CPDs prepared at 180 °C. (b) FT-IR spectra of SA and SG-CPDs. (c,d) XPS analysis of C 1s and O 1s of SG-CPDs. (e) UV–vis absorption and PL emission spectra of SG-CPDs. The inset is the photograph of the SG-CPD aqueous solution under 365 nm excitation. (f) PL spectra of SG-CPDs with different concentrations excited at 360 nm.

