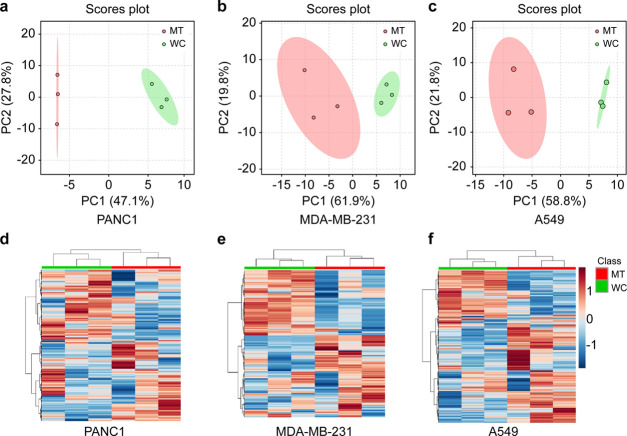
Figure 4.
Lipophilic metabolic profiles of mitochondria and bulk cells. Principal component analysis (PCA) score plots of (a) PANC1, (b) MDA-MB-231, and (c) A549. Heatmaps of (d) PANC1, (e) MDA-MB-231, and (f) A549. MT (red) indicates mitochondria, and WC (green) indicates whole cells or bulk cancer cells.

