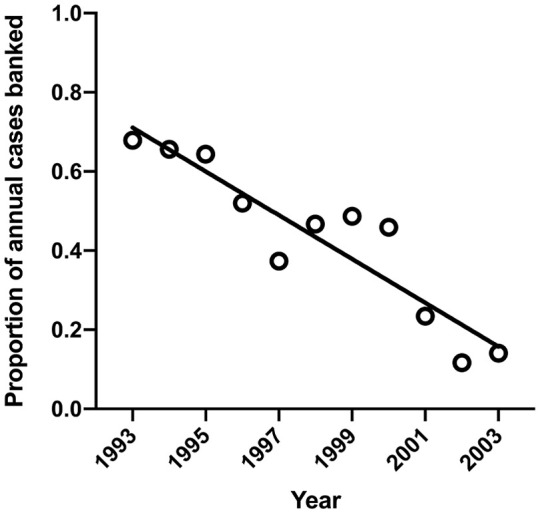
Figure 1.

Biobank collection profile.
Graph showing biobank collection profile over time. The graph shows the decline in the proportion of all incident breast cancer cases from which a frozen sample for research was collected by a provincial tumor biobank in Canada over a 10-year period.
