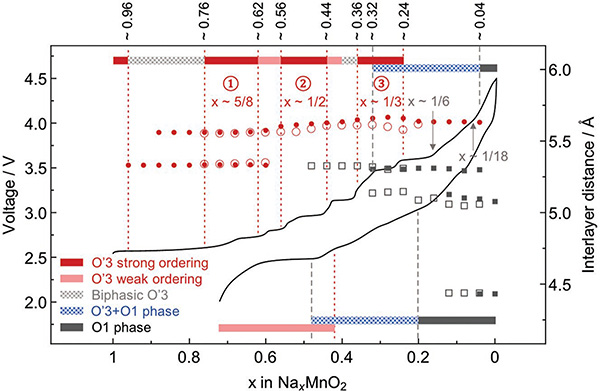
Figure 1.
Electrochemical profile and phase evolution of O′3-NaMnO2. The voltage profile of NaMnO2 in the first cycle between 2.0 and 4.5 V at C/50 rate as a function of Na composition measured from an in situ synchrotron XRD battery cell (XRD is shown in Figure 2), from which the phase evolution for charge (top bar) and discharge (bottom bar) is obtained. The corresponding interlayer distance at each Na composition for charge or discharge is shown by filled or empty symbols, respectively. The symbols for interlayer distance of O′3 phase are in red circles (filled or empty) and O1 phase in gray squares (filled or empty).

