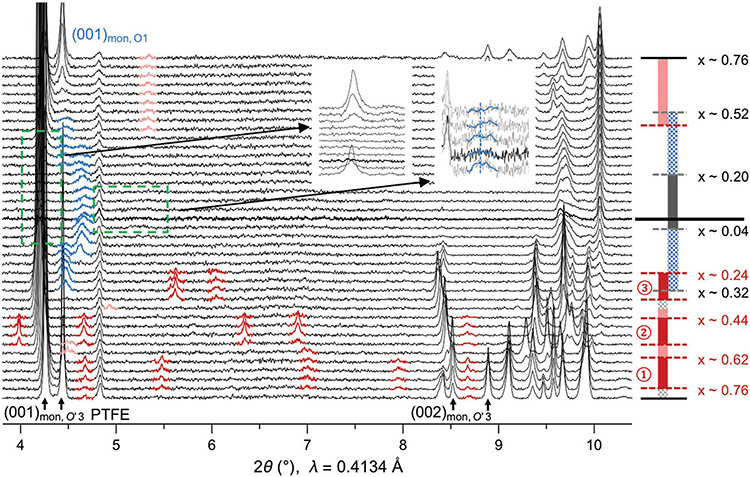
Figure 2.
In situ synchrotron XRD showing the superstructure evolution of NaMnO2 in the first electrochemical cycle. The phase evolution is the same as in Figure 1, and the thick black line in the middle region separates charge and discharge. The (001) and (002) peaks of O′3 phase, along with the static peak of the PTFE (polytetrafluoroethylene) binder, are marked at the bottom. The superstructure peaks are highlighted with dark red for the three strong ordering phases and lighter red for the weak ordering phases. The (001) O1 peaks in the high voltage O′3+O1 phase and O1 phase are highlighted by blue. The insets magnify the (001) peak regions at high voltage for O′3 phases (left inset) and O1 phases with lowest interlayer distance of 4.5 Å (right inset).

