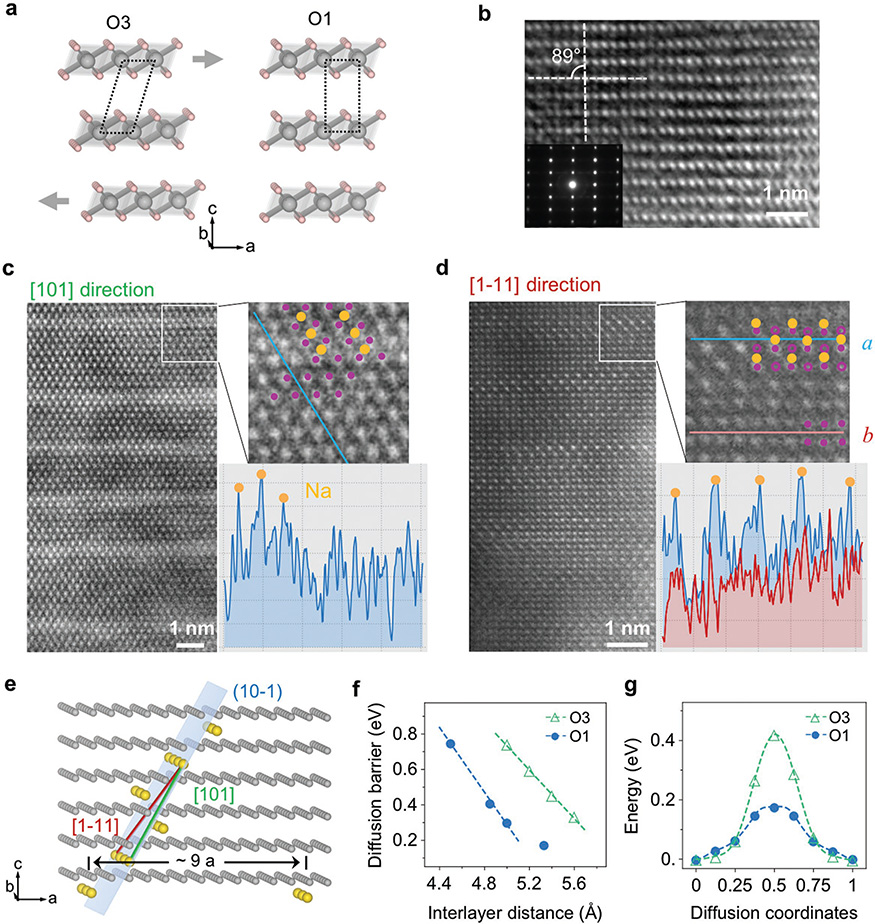
Figure 6.
High voltage O1 phase with Na condensation into widely separated superplanes at extremely dilute Na composition in Na0.06MnO2. a) Illustration of O3 (left) to O1(right) transition by gliding of the MnO2 planes. Gray arrows show the gliding direction. b) HRTEM image and inset electron diffraction taken in the b direction of the NaMnO2 sample charged to 4.0 V, showing the rectangle O1 stacking. c,d) STEM images taken along [101] and [1–11] directions, respectively, of the O1 phase Na0.06MnO2. The projected view of the solved superstructure model is superimposed on the magnified STEM images. An intensity line scan in inset (c) shows three peaks corresponding to the Na ion positions in our model. In inset (d), line scan of a (blue) shows much stronger peaks corresponding to the Na ions than the line scan of b (red) without expected Na ions in our model. e) Solved superstructure Na ordering in the O1 phase with zigzagged superplanes near the (10–1) plane (indexed with a 1 × 1 × 1 O1 unit cell). f) DFT calculated diffusion barrier of the O3 and O1 phases with changing interlayer distance. g) Comparison of diffusion energy profile of O3 and O1 phases.

