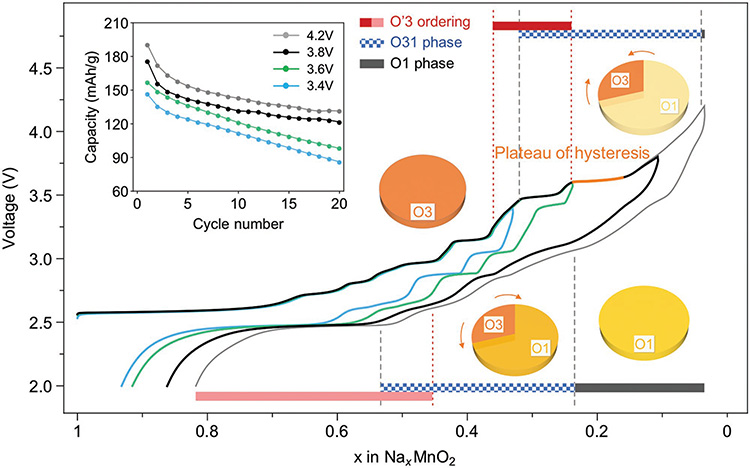
Figure 7.
Relationship between structural evolution and electrochemical performance of NaMnO2. Hysteresis between charge and discharge appears after passing the “Plateau of hysteresis.” Blue, green, black, and dotted curves are the first cycle of cells at C/10 rate charged to 3.4, 3.6, 3.8, and 4.2 V high voltage cutoff, respectively. The phase evolution in charge (top bar) and discharge (bottom bar) for 4.2 V cell is predicted by matching the same features of the voltage curve with the in situ SXRD one. The structural evolution of a cycle beyond the plateau of hysteresis is illustrated by four pie charts, where qualitatively darker (more red) corresponds to higher Na composition in that phase. Arrows show the evolution direction of phases. Inset shows the comparison of cyclability for different high cutoff voltages with the same low voltage cutoff of 2.0 V.

