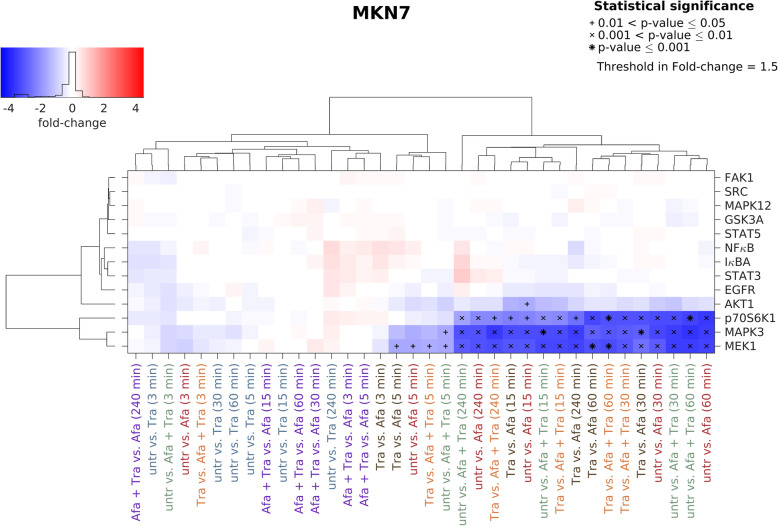
Fig. 4.
Effects of trastuzumab and afatinib on kinase phosphorylation in MKN7 cells. Luminex analysis was utilized to detect the effect of trastuzumab and/or afatinib on several protein tyrosine kinases in MKN7 cells. Cells were treated for 3, 5, 15, 30, 60 and 240 min with 0.5 μM afatinib, 5 μg/ml trastuzumab or the combination of both. In the batch-corrected cluster analysis, the x-fold change of each activated protein is shown. Samples were clustered based on the similarity of the activated proteins and treatment conditions. Significant effects between different treatment conditions are indicated by (*) with increasing size (0.01 < p-value ≤0.05, 0.001 < p-value ≤0.01 and p-value ≤0.001). Increasing protein phosphorylation/activation is indicated in red. Blue indicates decreasing protein phosphorylation/activation. Abbreviations: Afa = afatinib, Tra = trastuzumab, untr = untreated

