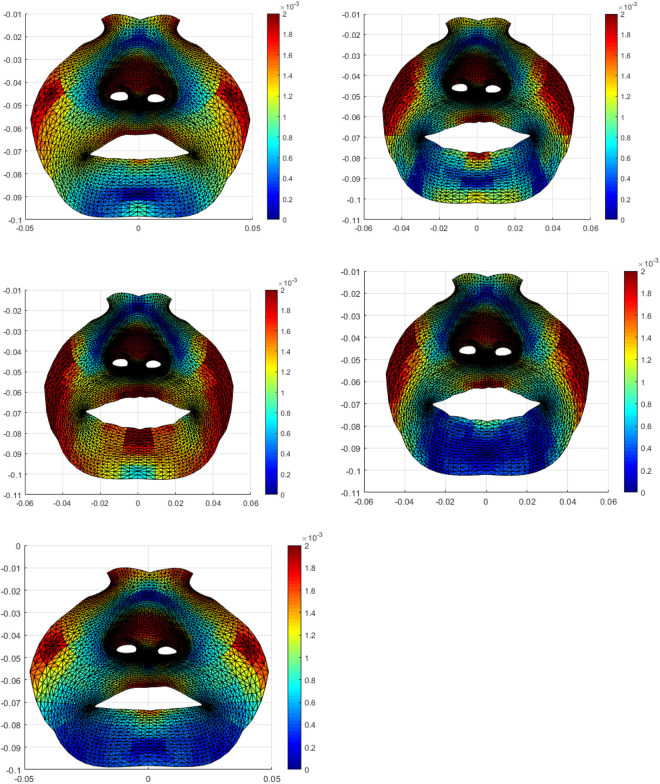
Figure 4.
Colour maps showing the average asymmetry of the maximum smile in UCLP patients of the five selected frames. Red areas represent maximum asymmetry. Frame 1 shows mild asymmetry of the vermilion border of the upper lip at rest. Frame 2 shows a more intense red colure affecting a wider region of both the upper and lower lips. Frame 3—The peak expression shows an increased asymmetry which became more obvious on the lower vermilion border. Frame 4—Residual asymmetry mainly of the upper vermilion. Frame 5 shows minimal asymmetry similar to the first frame. UCLP indicates unilateral cleft lip and palate.

