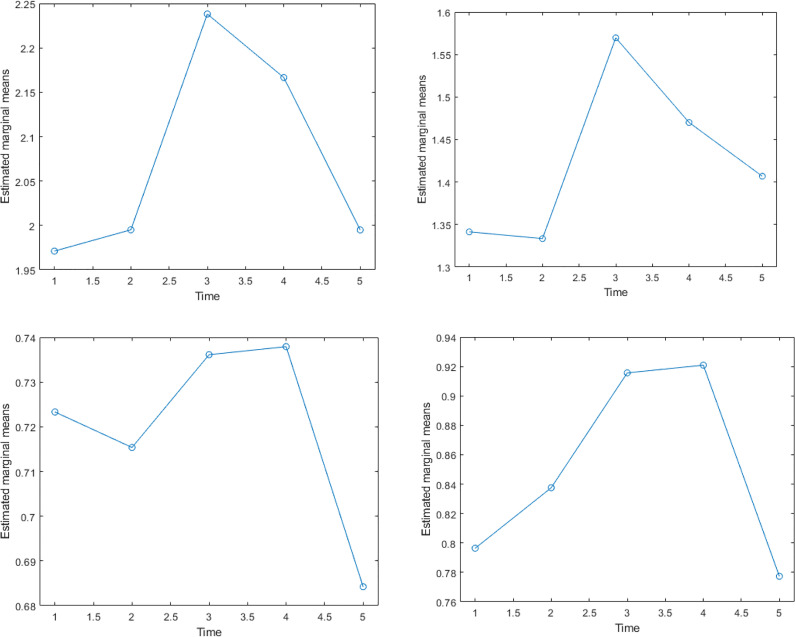
Figure 5.
Diagrammatic representation of the dynamics of facial asymmetry throughout the 5 frames with maximum smile of the UCLP cases. Top left shows the total asymmetry, top right shows the asymmetry in the X direction, the bottom left, and right show the asymmetry in the Y and Z directions accordingly. UCLP indicates unilateral cleft lip and palate.

