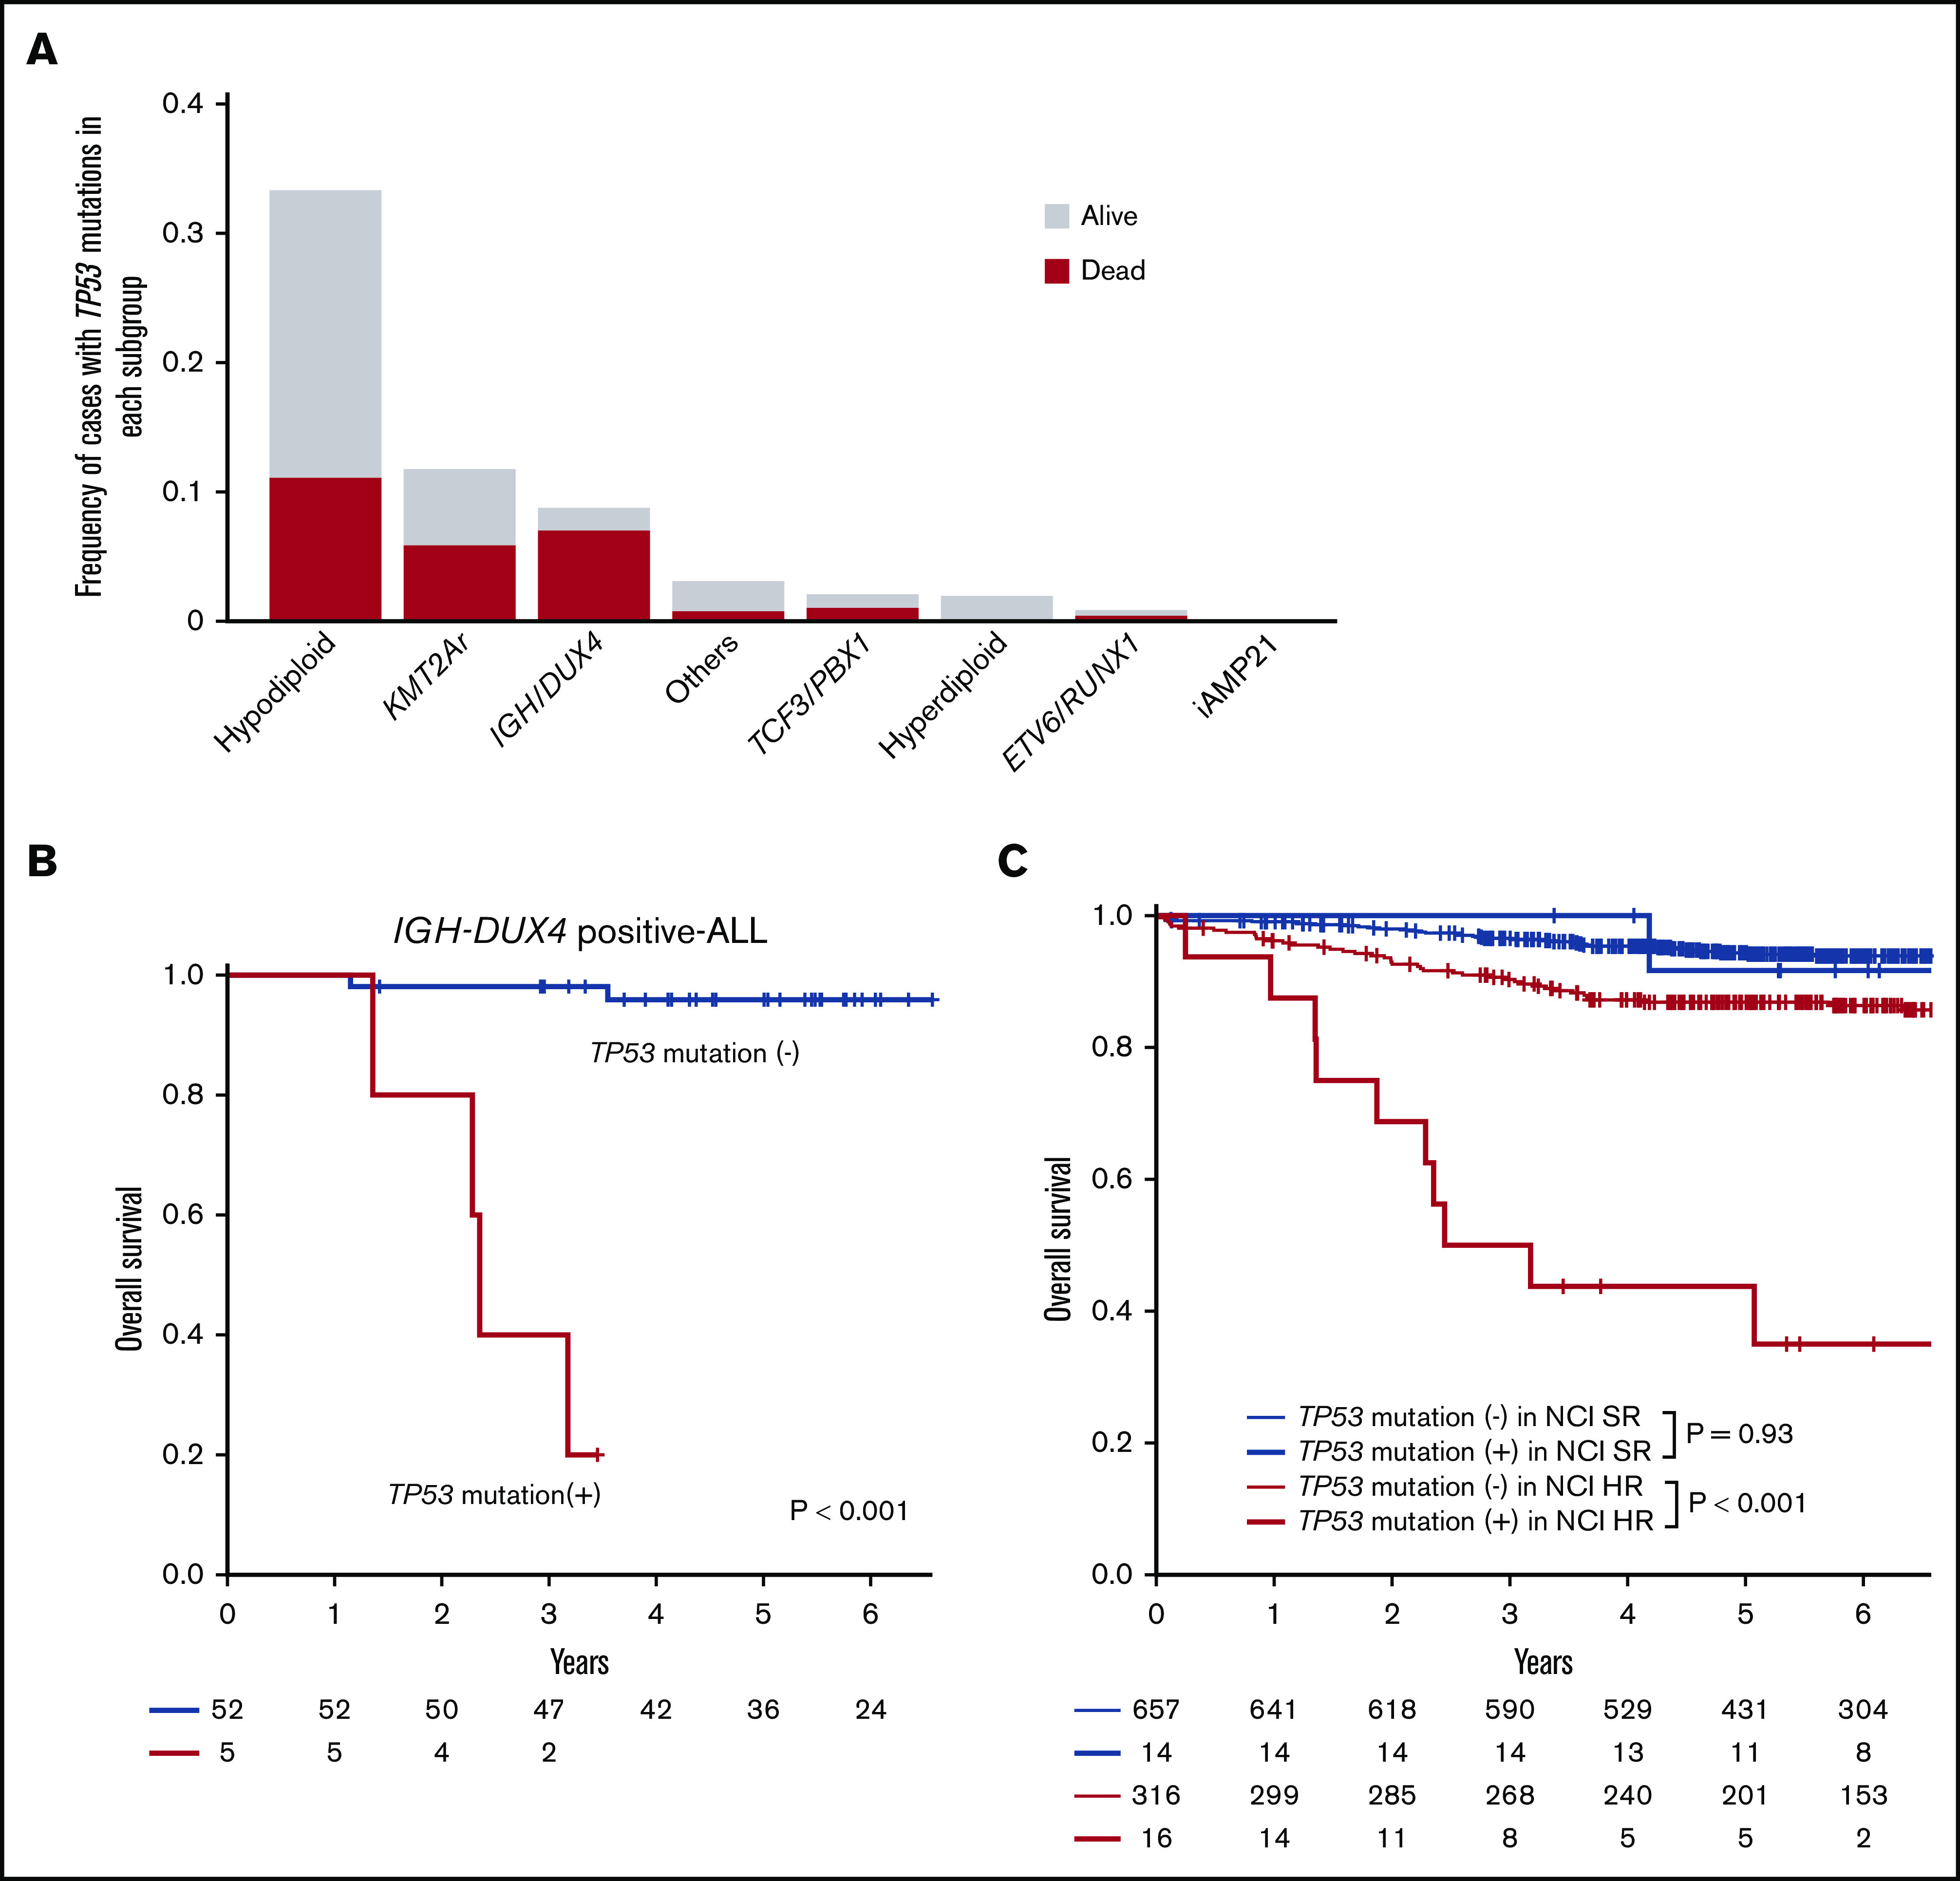
Figure 4.

Prevalence and prognostic impact of TP53 mutations. (A) Frequencies of TP53 mutations in each subgroup. Outcomes are indicated by colors. (B) Kaplan-Meier curves of overall survival for individuals with and without TP53 mutations in IGH-DUX4 positive-ALL. (C) Kaplan-Meier curves of overall survival among patients with or without TP53 mutations stratified with NCI criteria.
