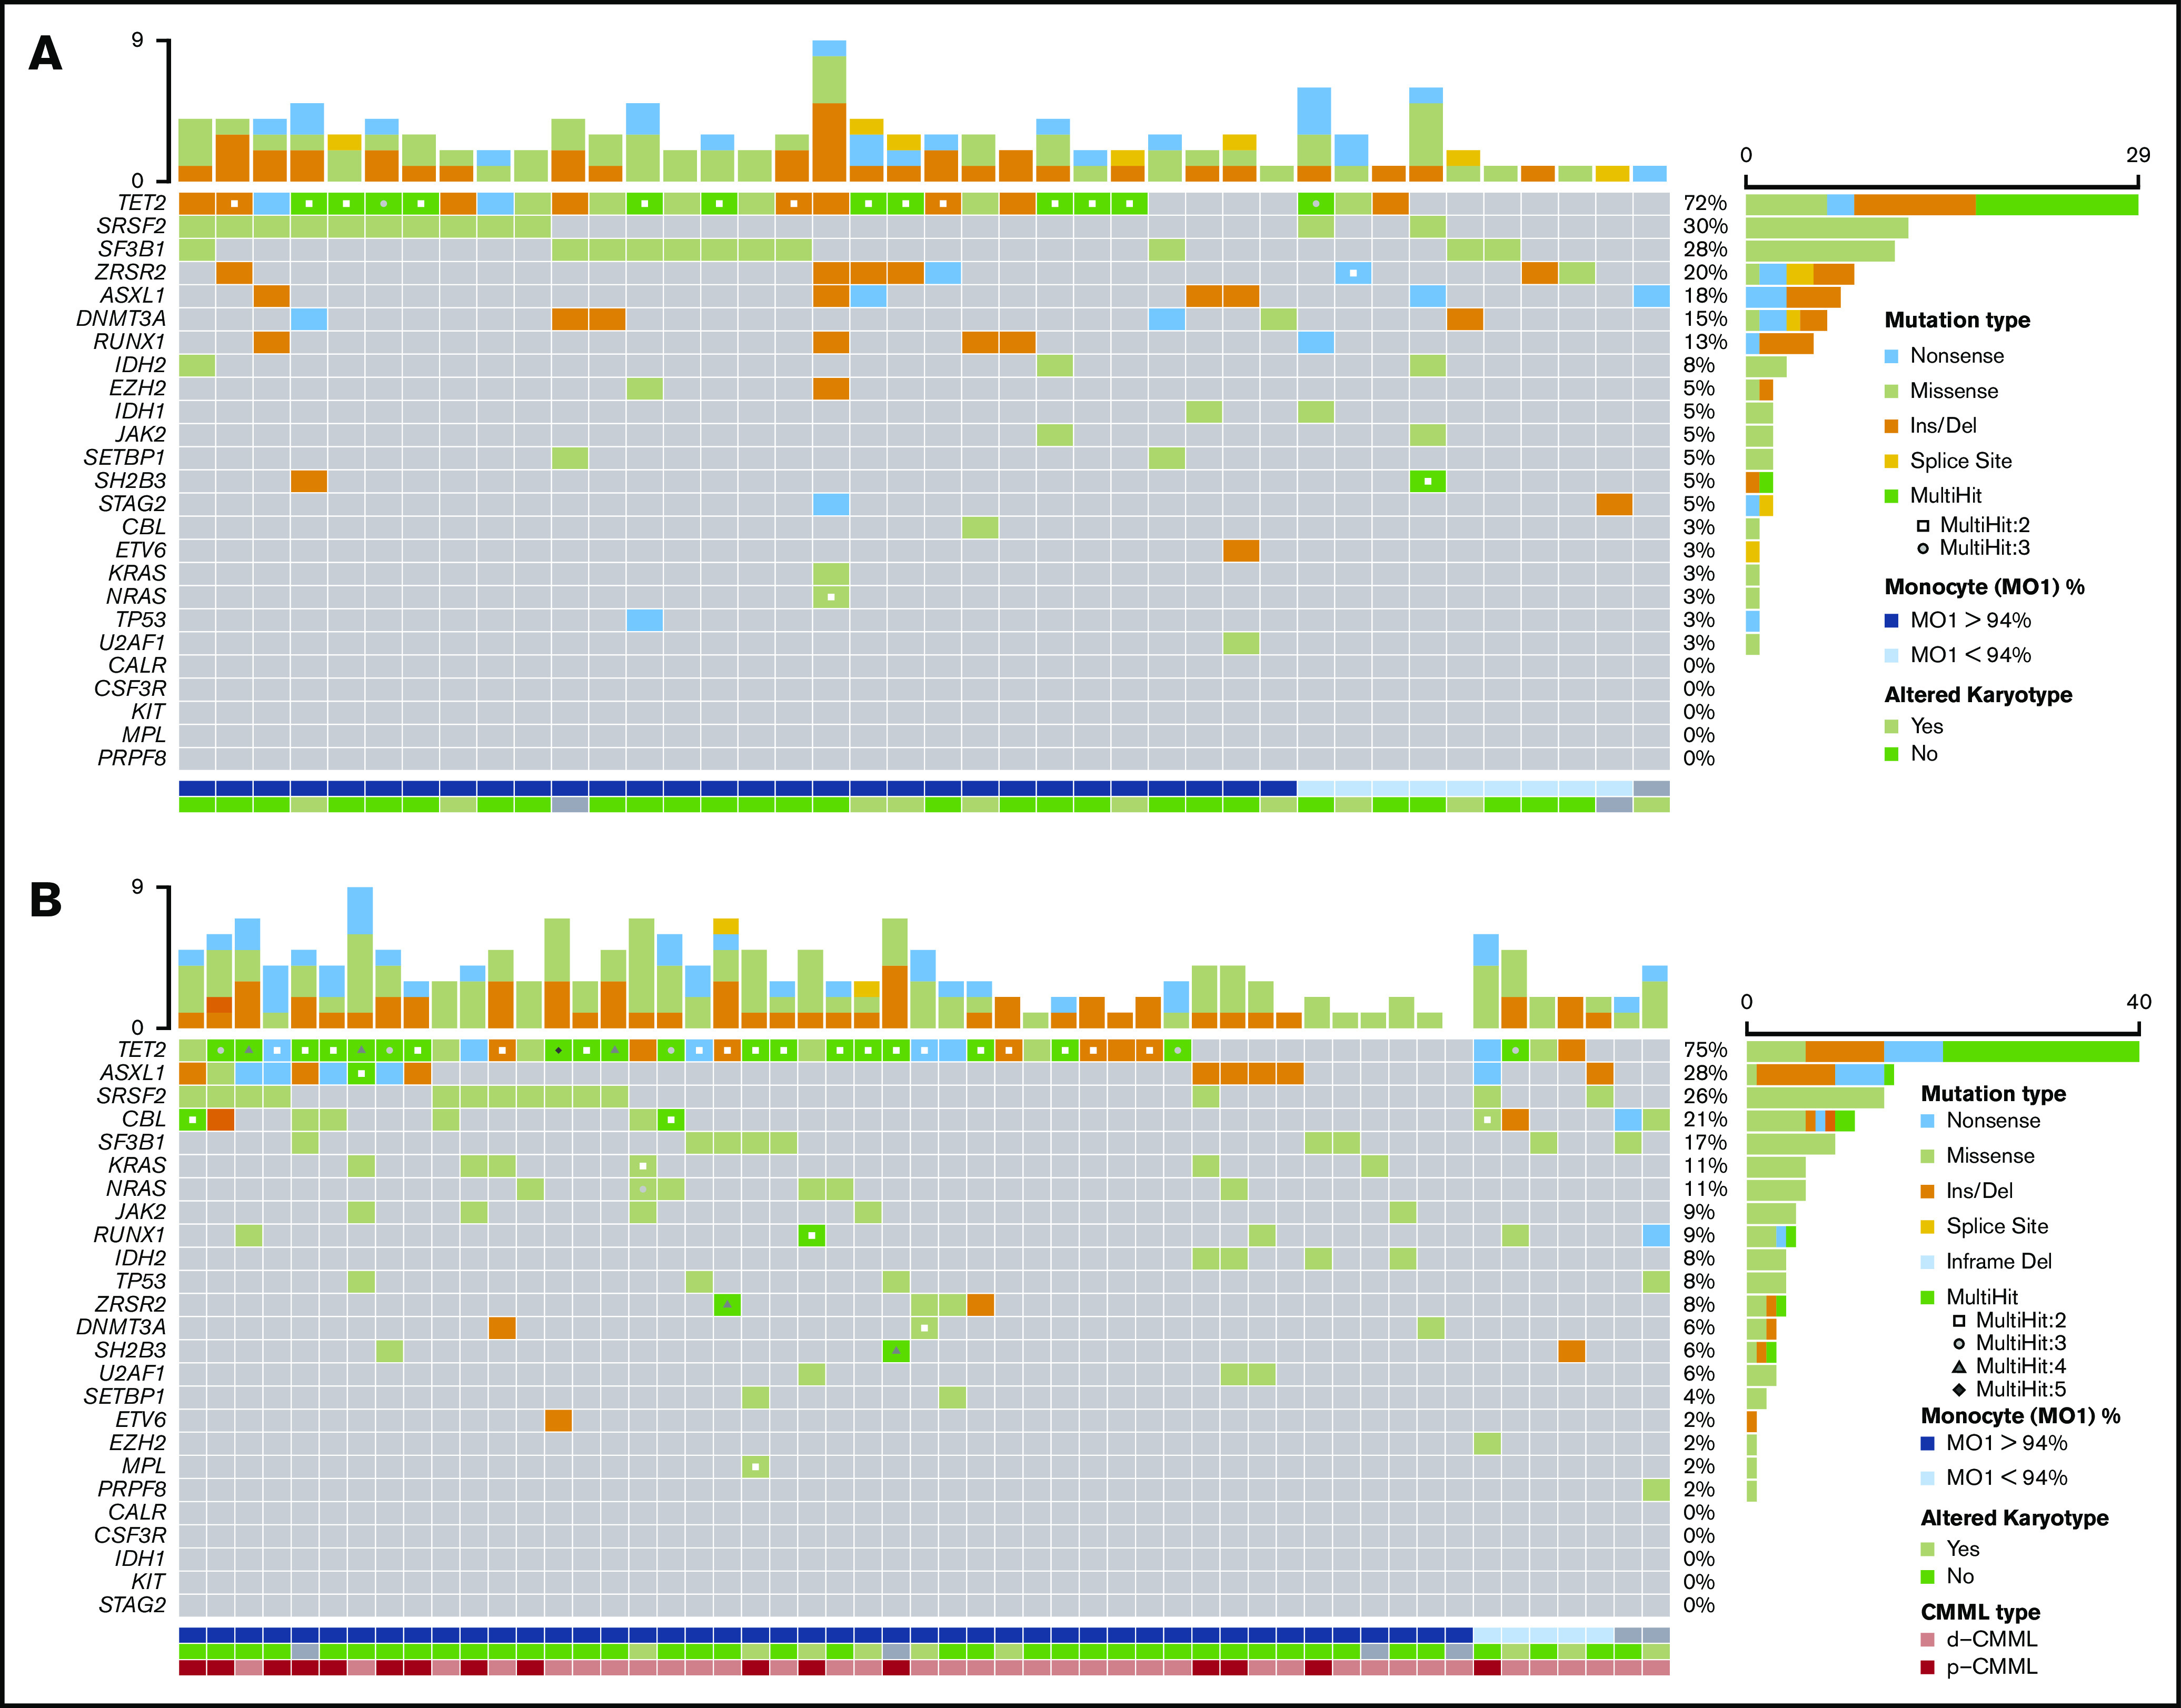
Figure 1.

Mutational profile in patients with OM-CMML and CMML. Mutations were identified by NGS in 40 patients with OM-CMML (A) and in 53 patients with CMML (B). Results of the sequencing of the 25 genes are shown in the plot, where each column represents a patient and each row represents a gene. The number of mutations identified per patient is represented as columns in the top row. Genes are ordered from the most to the least frequently mutated, and frequencies for each gene are displayed (right), as well as the mutation type (nonsense, missense, insertion/deletion, splice site, or multihit). Patients with more than 1 mutation in the same gene are represented as shown in the key (2, 3, 4, or 5 mutations in the same gene). The immunophenotypic profile, assessed by the presence of MO1s upper 94%, is shown (bottom; MO1 >94%, blue, MO1 ≤94%, light blue, nonanalyzed, gray). Cytogenetic results are also displayed (bottom row; altered karyotype, lime green; normal karyotype, light green; nonanalyzed, gray). CMML types are also shown (bottom row: d-CMML, light red; p-CMML, red).
