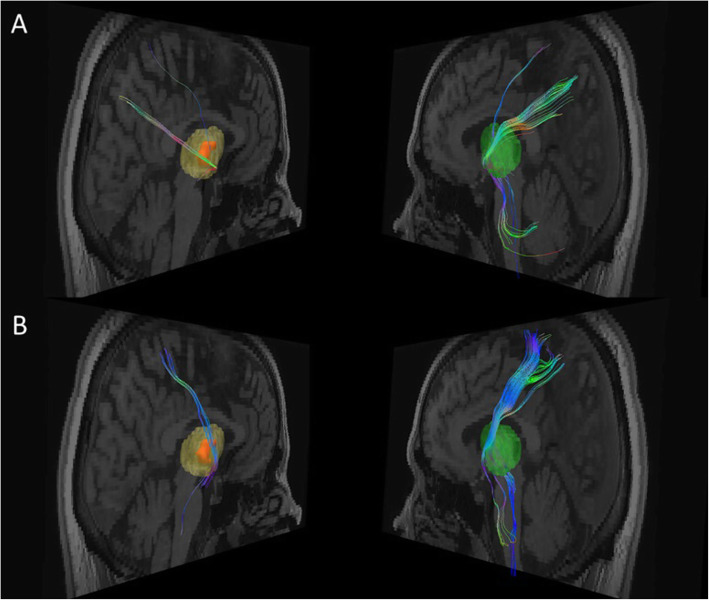
Fig. 3.
Fiber tracts connection between the right thalamic lesion area and respectively the precuneus (a) and the superior parietal lobule (b) from Brain Magnetic Resonance Imaging (Diffusion Tensor Imaging). Data were extracted from the same T1 brain image as in the Fig. 1c. The left panels show respectively a 3D reconstruction of the right thalamic lesion (orange) superimposed over the whole thalamic mask (in light yellow), and residual fibers. Their symmetric counterparts are shown in the right panels with the mask of the whole left thalamus (light green) and fiber tracts. White matter fibers colors code corresponds to their directions. Reduction in the number of fiber tracts through the lesion is visible for both targets of interest: 80% for the precuneus (a) and 90% for the superior parietal lobule (b)

