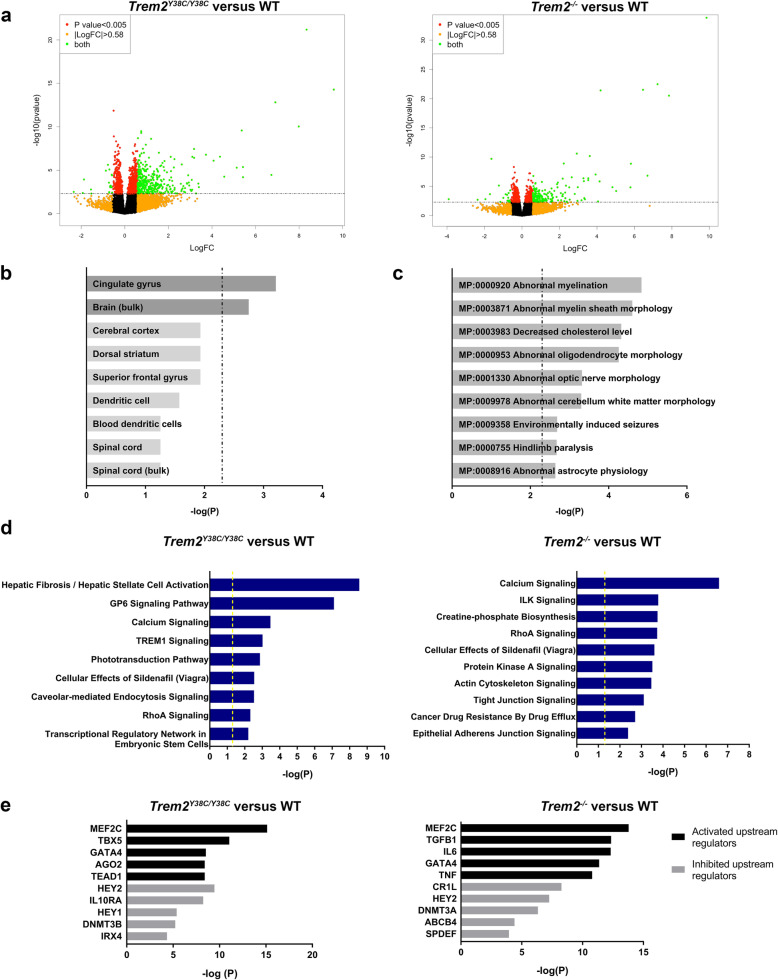
Fig. 2.
Loss of functional TREM2 alters gene expression associated with oligodendrocyte/myelin and neuronal function. a Volcano plot showing differentially expressed genes in 6 month Trem2Y38C/Y38C versus WT cortices and Trem2−/− versus WT cortices. Dashed line represents P < 0.005. Significantly altered genes are shown in green with downregulated and upregulated genes above |logFC| > 0.58 threshold of in green. b-c Enrichr pathway analysis of the shared downregulated genes between Trem2Y38C/Y38C and Trem2−/− mice (ranked by P value; Fischer’s exact test, P-adjusted, Benjamini-Hochberg method for correction for multiple hypotheses testing). b Tissue enrichment analysis showing significant enrichment in brain regions. Dashed line represents P < 0.005. c Enrichment analysis for specific cellular compartments showing myelin-related enrichment. Dashed line represents P < 0.005. d Top 10 pathways significantly altered using IPA pathway analysis. Analysis based on significantly differentially expressed genes between Trem2Y38C/Y38C versus WT mice and Trem2−/− vs WT mice. Yellow line represents P < 0.05 yellow line (ranked by P value, Fischer’s extact test). e Top 5 predicted upstream regulators of differentially expressed genes in Trem2Y38C/Y38C versus WT mice and Trem2−/− vs WT mice using IPA Upstream Regulator analysis. Activated (black) and inhibited (grey) upstream regulators are shown. P value, Fisher’s exact test. Sample sizes: WT mice, N = 8 (4 males, 4 females); Trem2Y38C/Y38C mice, N = 8 (4 males, 4 females); Trem2−/− mice, N = 5 (1 male, 4 females)

