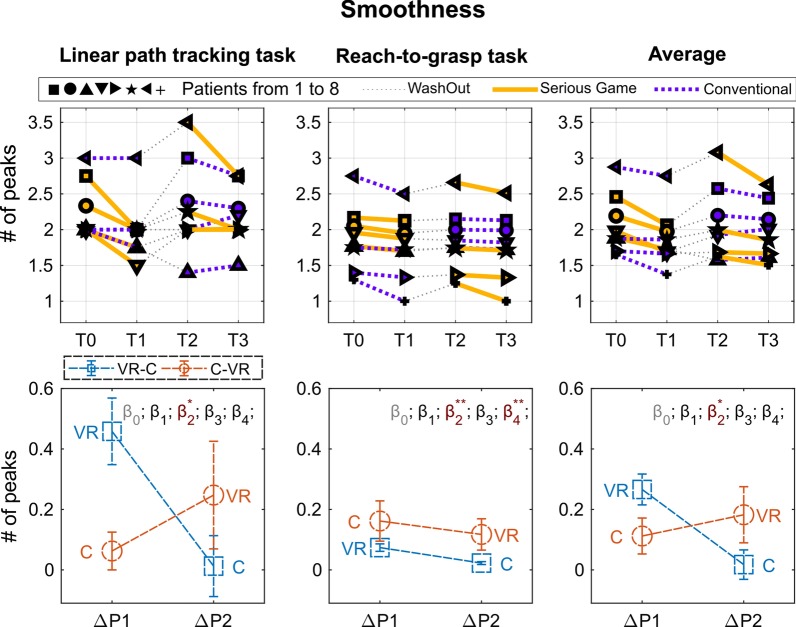
Fig. 6.
Results of the smoothness metric. Top graphs: Performance for each subject in the four assessment points: T0, pre-treatment assessment of Period 1; T1, post-treatment assessment of Period 1; T2, pre-treatment assessment of Period 2; T3, post-treatment assessment of Period 2. Period 1, from T0 to T1; Wash out, from T1 to T2; Period 2, from T2 to T3. Each subject is indicated by a different symbol and the kind of treatment he/she underwent in each period is marked by the color of the line (yellow for VR and blue for C). Bottom graphs: Performance changes between post- and pre-treatment measurements () averaged over subjects within each period ( and ). In order to improve the readability of the graphs in such a way to have higher values for better performance, was multiplied by minus one. Colors distinguish the two groups (experimental sequence). Statistical significances of the LME model parameters are marked through asterisks (see Eq. 1, intercept, period, treatment, baseline, period*treatment)

