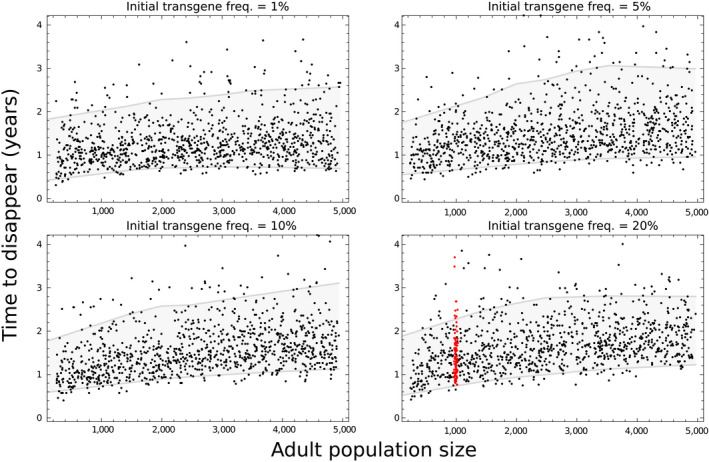
FIGURE 4.

Predictions of transgene longevity in the population over a range of population sizes and initial transgene proportions. Each point plots the time to disappearance of the transgene in a simulation of the posterior‐informed model, against the average adult population size in that simulation (post release). The population size was varied among simulations by varying the number of pupae added back into the population from each twice‐weekly cohort of eggs. The introduced transgenic frequency in the cage experiment was 20%, and for this panel the red points indicate that the model simulated the restocking rate that was used in the population experiment. The grey region shows the 90% central quantile of the points
