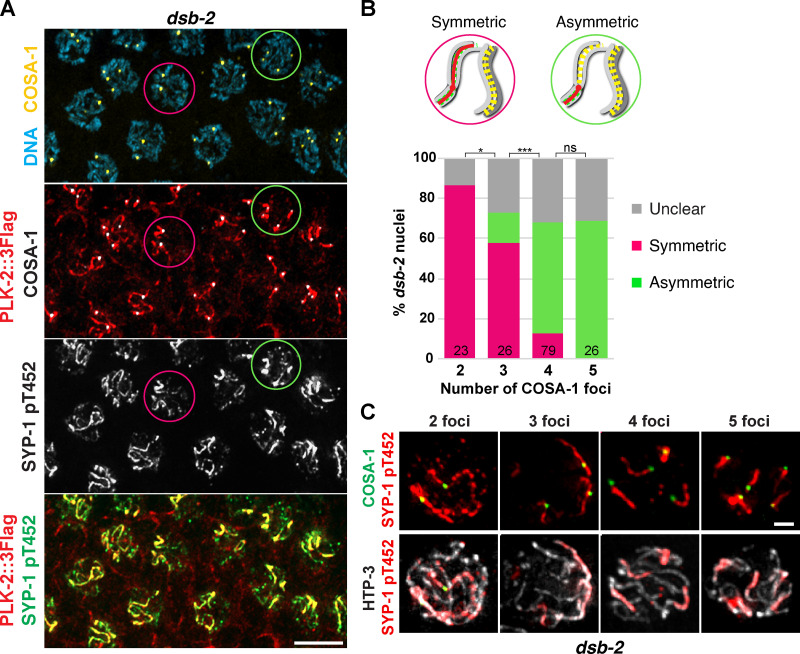
Figure 5.
Threshold levels of crossovers are required for asymmetric enrichment of SYP-1 T452 phosphorylation. (A) Immunofluorescence images of late pachytene nuclei from wild-type and dsb-2 mutants showing DNA (blue), COSA-1 (yellow), PLK-2 (red), and SYP-1 pT452 (green) staining. Circles represent examples of nuclei showing either symmetric (magenta) or asymmetric (green) SYP-1 pT452/PLK-2 localization relative to COSA-1. Scale bar, 5 µm. (B) Diagrams illustrating nuclei with the symmetric versus asymmetric SYP-1 pT452 staining and a graph showing the distribution of SYP-1 pT452 staining in dsb-2 nuclei with two COSA-1 foci (n = 23), three COSA-1 foci (n = 26), four COSA-1 foci (n = 79), and five COSA-1 foci (n = 26). *, P < 0.05; ***, P < 0.0001; ns, not significant (P > 0.05) by Fisher’s exact test. (C) Late pachytene nuclei from dsb-2 mutants were stained for SYP-1 pT452 (red), COSA-1 (green), and HTP-3 (white) and categorized by the number of COSA-1 foci. Scale bar, 1 µm.

