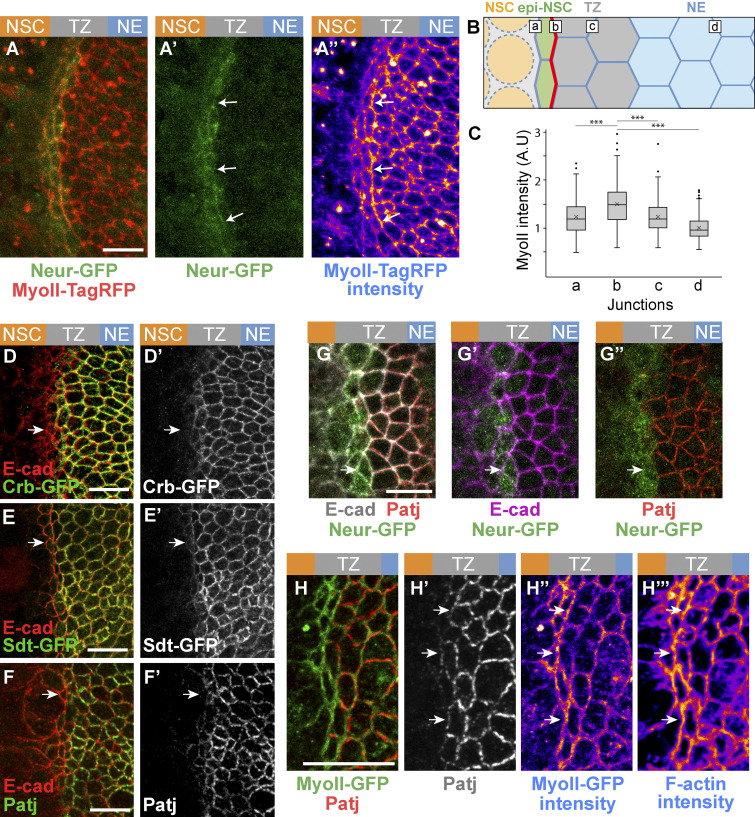
Figure 3.
Low Crb in epi-NSCs correlates with polarized junctional MyoII. (A–A″) Snapshot of a brain expressing MyoII-TagRFP (red in A, intensity levels in A″) and Neur-GFP (green) showing an enrichment of junctional MyoII at the cell–cell contact between epi-NSC and more lateral TZ cells (arrows). Neur localized at the apical cortex (A′). (B) Diagram illustrating the different cell–cell contact used for the quantification of junctional MyoII, i.e., between NSCs and epi-NSCs (a), epi-NSCs and immediately adjacent TZ cells (b), between Neur-negative TZ cells (c) and lateral NE cells (d). (C) Box plots of junctional MyoII intensity at four distinct junctions as in B. MyoII is significantly enriched at b junctions relative to all others (n = 6, ***, P values <10−15, one-way ANOVA, Scheffé multiple comparison tests). (D–G″) Crb-GFP (green; D and D′), Sdt-GFP (green, all isoforms; E and E′) and Patj (green in F and F′; red in G and G″), but not E-cad (red in D, E, and F; magenta in G′′), were specifically down-regulated in apically constricted epi-NSCs (Neur-GFP, green, in G–G″). While E-Cad appeared to colocalize with Crb complex proteins in these apical z-projections, AJs are actually located just basal to Crb (see Fig. S2). (H–H″′) MyoII-GFP (green, H) was enriched along junctions lacking Patj (red; see arrows in H′ and H″). F-actin (phalloidin staining, H″′) was also enriched along junctions lacking Patj (arrows). Scale bars = 10 µm.

