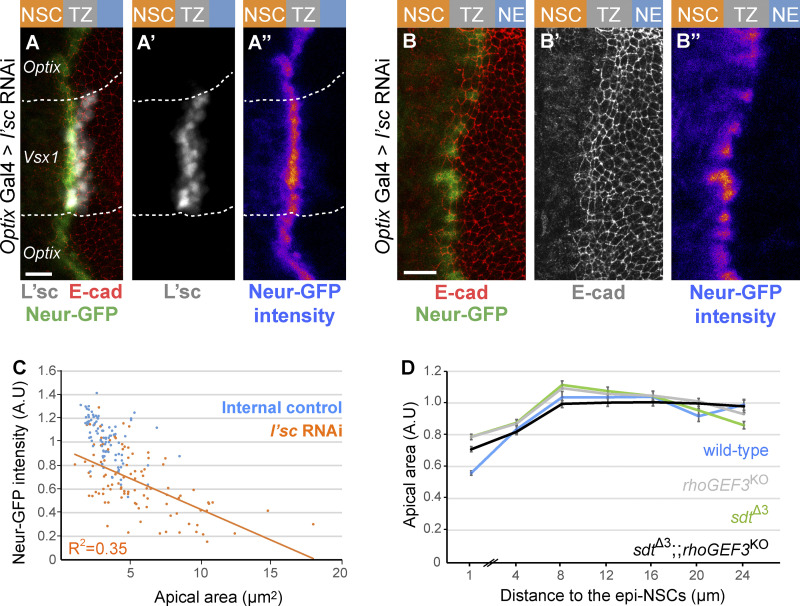
Figure S4.
Regulation of apical constriction by Neur and RhoGEF3. (A–B″) RNAi-mediated knockdown of l’sc expression in the Optix domain induced a strong loss of L’sc (white in A and A′) which was associated with a decrease in Neur-GFP (green in A; intensity in A″; compare epi-NSCs of the Optix and Vsx1 domains in A–A″). A high degree of cell-to-cell heterogeneity in Neur-GFP levels was seen upon l’sc knockdown (B–B″). (C) Quantification of apical area (normalized, A.U [arbitrary units]) in the NE of sdtΔ3 rhoGEF3 double mutants (black; n = 9 brains) plotted against the distance from the TZ medial edge (70–474 cells per binned distance). The phenotype of the double mutant appeared to be similar to those of rhoGEF3 (data from Fig. 6 D) and sdtΔ3 (data from Fig. 5 E; wild-type data from Fig. 6 D): double mutant cells located within 0–2 µm of the TZ medial edge do not have significantly different apical areas than either single mutant (ANOVA). (D) Neur-GFP intensity values (normalized to mean GFP values of control epi-NSCs from the same brain; maximal projection of apical Δz = 2 µm) were plotted against apical area for 102 epi-NSCs (n = 5 optix>l’sc RNAi brains). An inverse correlation between Neur-GFP intensity and apical area was observed, suggesting that Neur positively regulates apical constriction. Scale bars = 10 µm.

