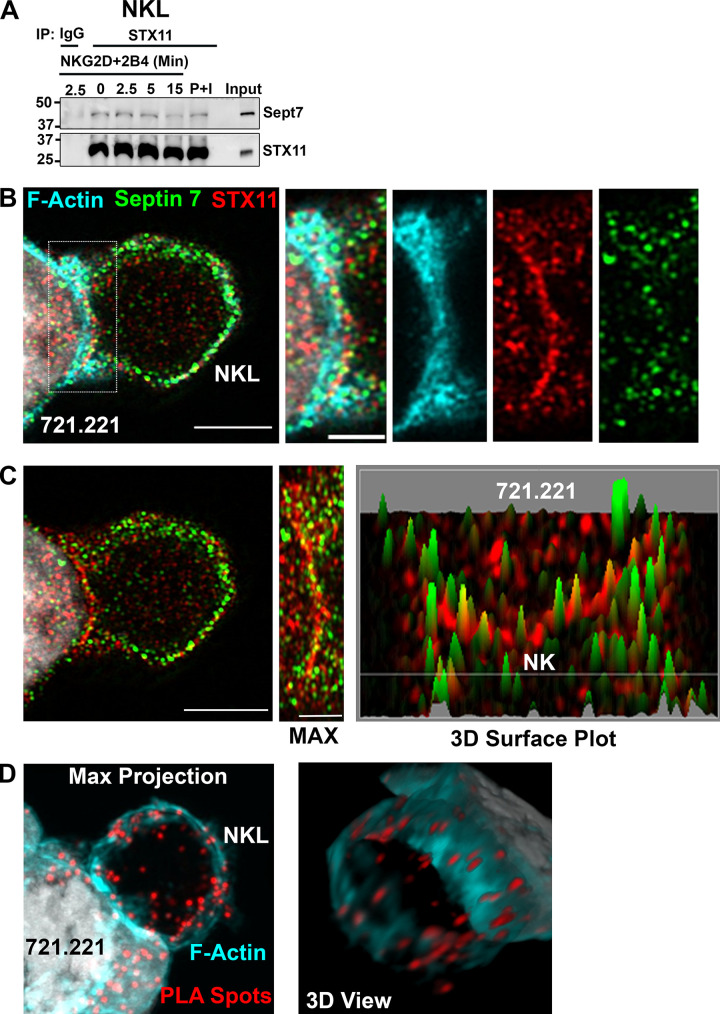
Figure 7.
Septin 7 interacts with STX11. (A) Unstimulated, cell surface receptor (NKG2D + 2B4) activated (time-course) and PMA (2 µM) and ionomycin (4 µM) (P+I) stimulated (15 min) NKL cells were lysed and immunoprecipitated (IP) with antibody against STX11 or rabbit IgG and immunoblotted as indicated. The immunoblot shown is a representative of three independent experiments. (B) NKL cells in conjugates with 721.221 cells were stained for F-actin (cyan), septin 7 (green), and STX11 (red) and z-stack images were obtained and processed using Airyscan (slice 3 of 14 is shown). The localization of the indicated proteins at the CS are enlarged (dashed box) and shown to the right. Scale bar, 5 µm; inset scale bar, 2.5 µm. (C) A maximum intensity projection of the Airyscan image for septin 7 and STX11 (from B) is shown with the CS enlarged (middle panel) along with a 3D surface plot (far right) of septin 7 (green) and STX11 (red). Scale bar, 5 µm; inset scale bar, 2.5 µm. (D) STX11-septin 7 interaction was also assessed by PLA. NKL cells were incubated with rabbit anti-STX11 and mouse anti-septin 7 antibodies. Subsequently, cells were incubated with plus and minus probes and later ligated and amplified. Cells were stained with phalloidin to visualize F-actin (cyan). Z-stack images were obtained and processed using Airyscan. Representative maximum intensity projection of z-stack and 3D view of the same are shown. Scale bar, 5 µm.

