Figure 8.
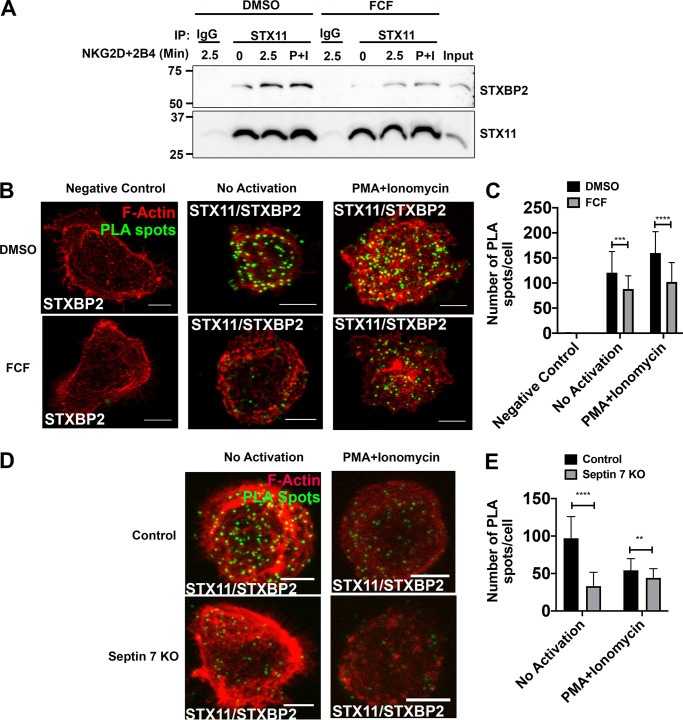
Stabilization of septin filaments or depletion impairs interaction between STX11 and STXBP2. NKL cells were treated with DMSO (control) or 75 µM FCF for 3 h. (A) Equal number of DMSO- and FCF-treated cells were either not activated or activated by ligation of NKG2D and 2B4 receptors for 2.5 min or PMA (2 µM) and ionomycin (4 µM; P+I) for 15 min at 37°C. Cells were lysed and immunoprecipitated (IP) with anti-STX11 antibody or rabbit IgG and immunoblotted for STXBP2 and STX11. (B and C) STX11–STXBP2 interaction was also assessed by PLA. DMSO- and FCF-treated NKL cells were plated on the fibronectin-coated coverslips and incubated with rabbit anti-STX11 and mouse anti-STXBP2 antibodies. Mouse anti-STXBP2 antibody by itself was used as a negative control. Subsequently, cells were incubated with plus and minus probes and later ligated and amplified. Cells were stained with phalloidin to visualize F-actin (red). Z-stack images were captured using a confocal microscope, and PLA spots (green) were counted using ImageJ. Details are described within the Materials and methods section. (B) Representative maximum intensity projection of z-stack. Scale bar, 5 µm. (C) Quantification of PLA spots. Results shown are representative of three independent experiments with minimum 30 cells counted per group per experiment. (D and E) NKL cells were nucleofected with either control gRNA or two different gRNAs, targeting septin 7 gene (Sept7 KO), in complex with tracrRNA and Cas9 enzyme. 96 h after nucleofection, STX11–STXBP2 interaction was assessed by PLA as described above. (D) Representative maximum intensity projection of z-stack. Scale bar, 5 µm. (E) Quantification of PLA spots. Error bars indicate SEM. **, P < 0.005; ***, P < 0.0005; ****, P < 0.00005 compared with control group. P values indicated are for unpaired, two-tailed Student’s t test.

