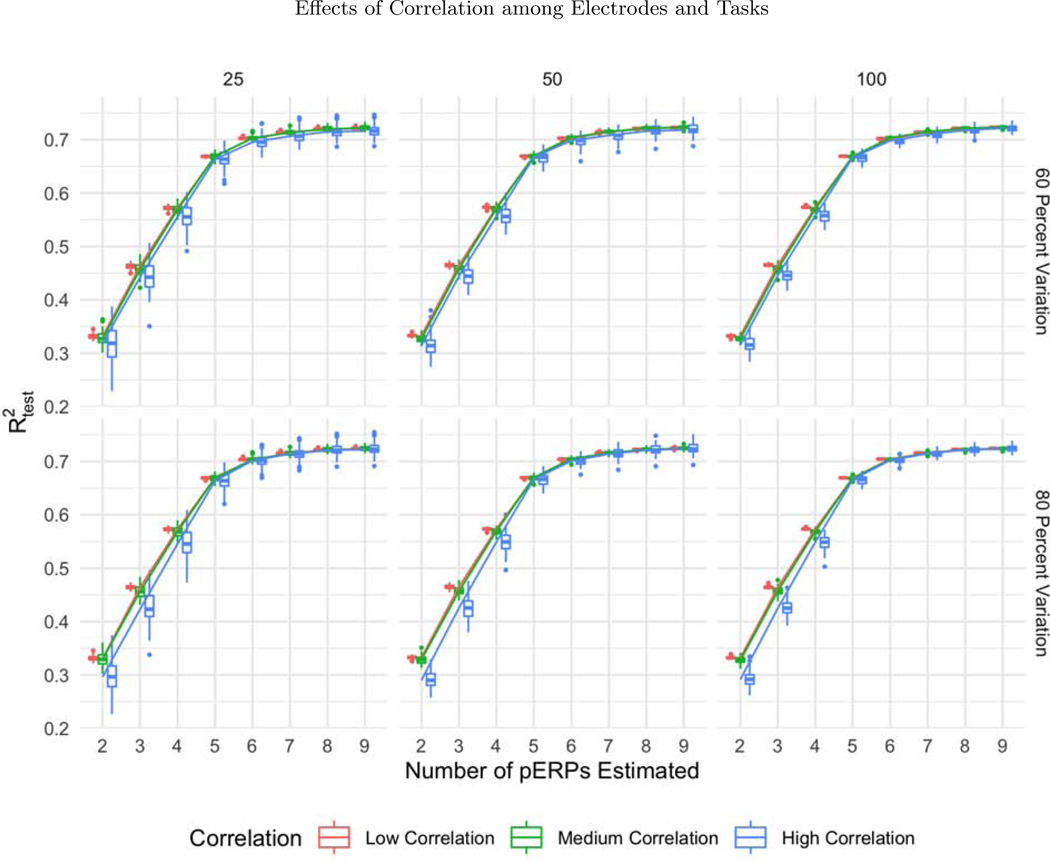
Figure 6:
The boxplots of as a function of the number of pERPs estimated across 100 simulations with 60 (first row) and 80 percent variation retained (second row) and N = 25 (first column), 50 (second column), and 100 (third column) for low (red), medium (green) and high (blue) correlation between electrodes and tasks. With increasing correlation, we see increasing variability in prediction accuracy.

