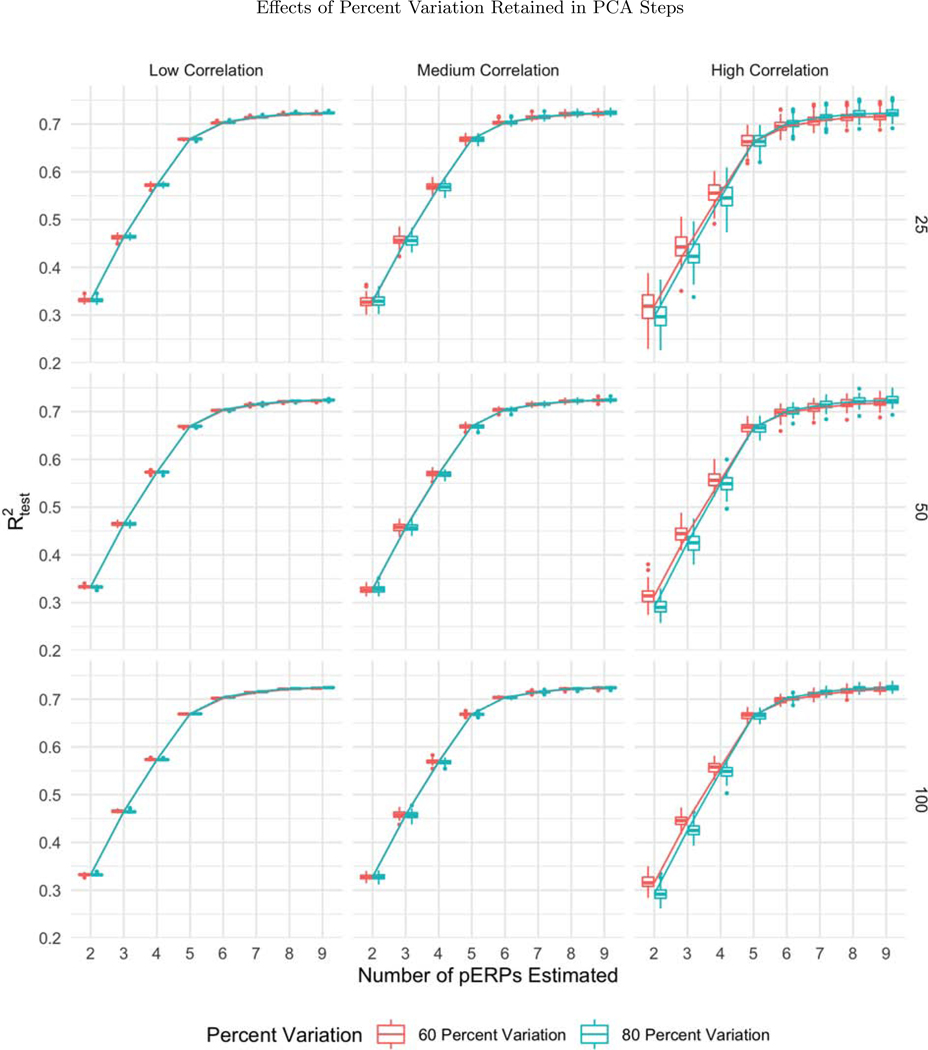
Figure 7:
The boxplots of as a function of the number of pERPs estimated across 100 simulations with N = 25 (first row), 50 (second row), and 100 (third row) and low (first column), medium (second column) and high (third column) correlation between electrodes and tasks for 60 (red) and 80 (blue) percent variation retained. When the correlation is high, retaining more variation in PCA corresponds to retaining more noise, leading to worse prediction accuracy.

