Figure 1.
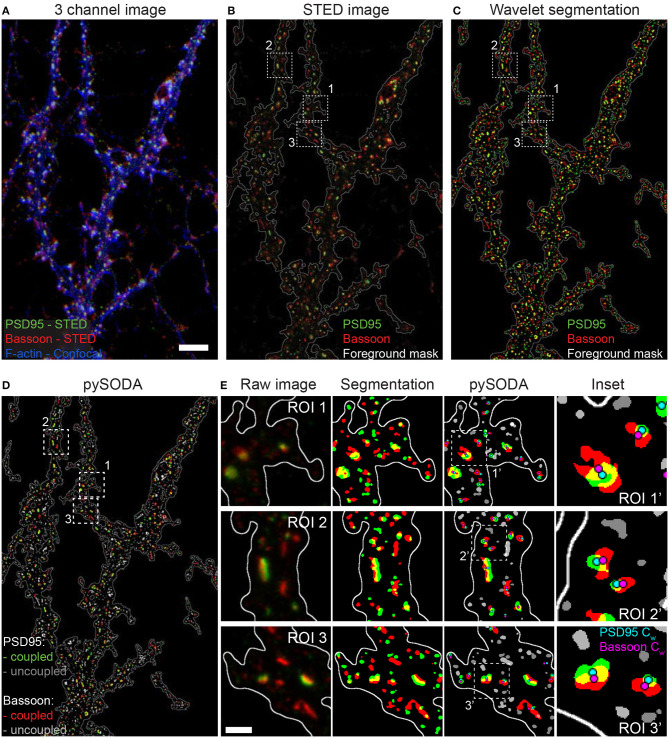
Statistical object distance analysis (SODA) of two-color STED images of the scaffold protein pair PSD95 and Bassoon. (A) 3 channel image of a neuron stained with Bassoon-STAR 635P (red), PSD95-Alexa 594 (green) with the corresponding confocal image of Phalloidin-Oregon Green 488 (blue). To better distinguish low intensity clusters combined with the F-actin staining, a log intensity scale was used. (B) Raw 2-color STED image (linear intensity scale) showing the region boundaries used for SODA analysis (white contour line). (C) Segmented clusters, within the region boundaries, of PSD95 (green) and Bassoon (red) using wavelet transform. (D) pySODA analysis of the image shown in (C). Coupled (Bassoon-red, PSD95-green) and uncoupled (Bassoon-light gray, PSD95-dark gray) clusters identified with the pySODA analysis approach. (E) Representative regions of interest (ROI) from the image shown in (D) (Insets 1-3) showing the raw 2-color STED images (left), the corresponding segmented clusters within the foreground mask (middle-left) as well as the coupled and uncoupled clusters identified with pySODA (middle-right) and enlarged insets (ROI') from the pySODA map (right). Cyan (PSD95 Cw) and magenta (Bassoon Cw) circles represent the weighted centroids of coupled clusters (right). Scale bars: 5 μm (A), 500 nm (E).

