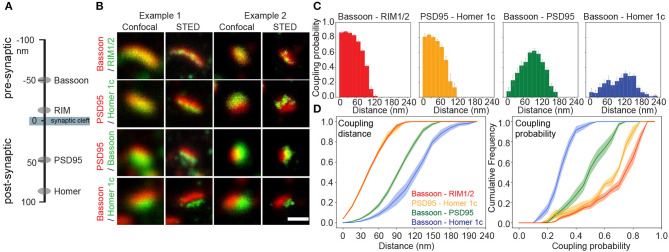
Figure 2.
Coupling properties of synaptic scaffold protein pairs at low neuronal activity measured with pySODA. (A) Schematic representation of the axial positions of the four synaptic scaffold proteins analyzed in this work. (B) Two examples of representative confocal and STED images of synaptic scaffold pairs. (C) Coupling probability and distance histograms measured for coupled cluster pairs of Bassoon - RIM1/2 (red, n = 16), PSD95 - Homer1c (yellow, n = 6), Bassoon - PSD95 (green, n = 18), Bassoon - Homer1c (blue, n = 17). Each 15 nm bin represents the average coupling probability calculated from the individual images of independent neurons with standard error. (D) Cumulative frequency plots of coupling distance (left) and coupling probability (right) for each synaptic element pair with standard error (shaded area). (C,D) n = number of neurons from 2 independent cultures. Statistical difference between scaffold protein pairs was assessed using a randomization test (see section Materials and Methods and Supplementary Figure 4). Scale bar 250 nm.

