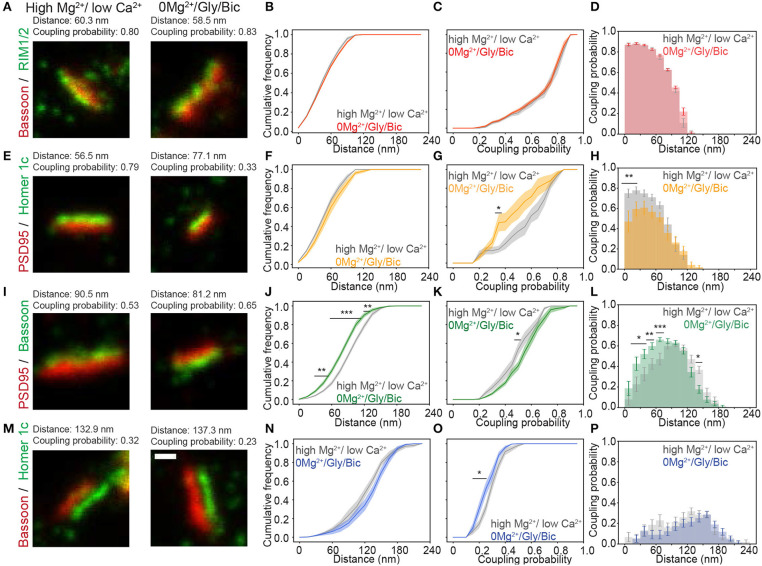
Figure 3.
Activity-dependent re-organization of pre- and postsynaptic scaffolding protein pairs measured with the pySODA analysis framework. (A,E,I,M) Representative two-color STED images of synaptic protein pairs for the activity reducing high Mg2+/low Ca2+ condition (left) or synaptic stimulation 0Mg2+/Gly/Bic (right). Cumulative frequency graphs of the coupling distance (B,F,J,N) and of the coupling probability (C,G,K,O) measured for coupled protein pairs. (D,H,L,P) Histograms of the mean coupling probability per neuron at a given distance. Measurements were performed on two-color STED images of (A–D) the presynaptic protein pair Bassoon - RIM1/2 (High Mg2+ / low Ca2+(gray): n = 16 and 0Mg2+/Gly/Bic (red): n = 21); (E–H) the postsynaptic protein pair PSD95 - Homer1c (high Mg2+ / low Ca 2+(gray): n = 9 and 0Mg2+/Gly/Bic (orange): n = 12); (I–L) the transsynaptic pair Bassoon - PSD95 (High Mg2+/ low Ca 2+(gray): n = 18 and 0Mg2+/Gly/Bic (green): n = 24) and (M–P) the transsynaptic pair Bassoon - Homer1c (High Mg2+/ low Ca 2+(gray): n = 17 and 0Mg2+/Gly/Bic (blue): n = 17). Shown are the means (plain lines) with standard error (shaded area). n = number of neurons from 3 independent cultures. Statistical difference was assessed using a randomization test (see section Materials and Methods and Supplementary Figure 6). Exact p-values are reported in Supplementary Figure 6, with *p < 0.05, **p < 0.01, and ***p < 0.001. Scale bar 250 nm.

