Figure 6.
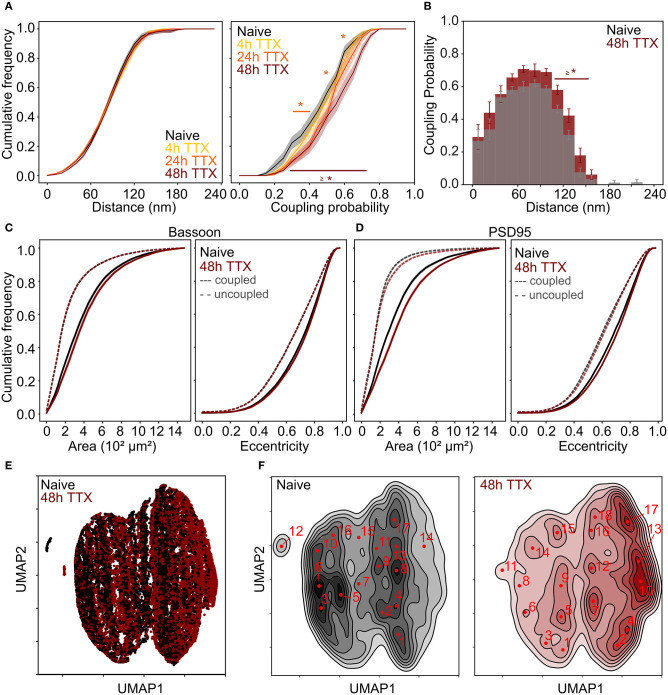
Chronic TTX treatment induced re-organization of the synaptic scaffold protein pair Bassoon - PSD95. (A) Cumulative frequency curves of the coupling distance (left) and probability (right) measured for coupled Bassoon and PSD95 clusters for naive (gray, n = 35), 4 h TTX (light orange, n = 20), 24 h TTX (dark orange, n = 23) and 48 h TTX (red, n = 33). (B) Histogram of the mean coupling probability per neuron at a given distance for naive (gray) and 48 hours TTX (red). (C,D) Cumulative frequency curves of the area (left) and eccentricity (right) of coupled (solid line) and uncoupled (dashed line) Bassoon (C) and PSD95 (D) protein clusters. (E) Scatterplot of the UMAP embedding and (F) corresponding KDE plots of coupled Bassoon clusters for naive (black) and 48 h TTX (red). Subtypes of synaptic clusters are indicated on the KDE maps (numbers in red) referring to local maxima (see section Materials and Methods). (A,C,D) Shown are the means with standard error (shaded area). Statistical difference was assessed using a randomization test (see section Materials and Methods, Supplementary Figures 18, 21). n = number of neurons from 2 independent neuronal cultures.

