Figure 7.
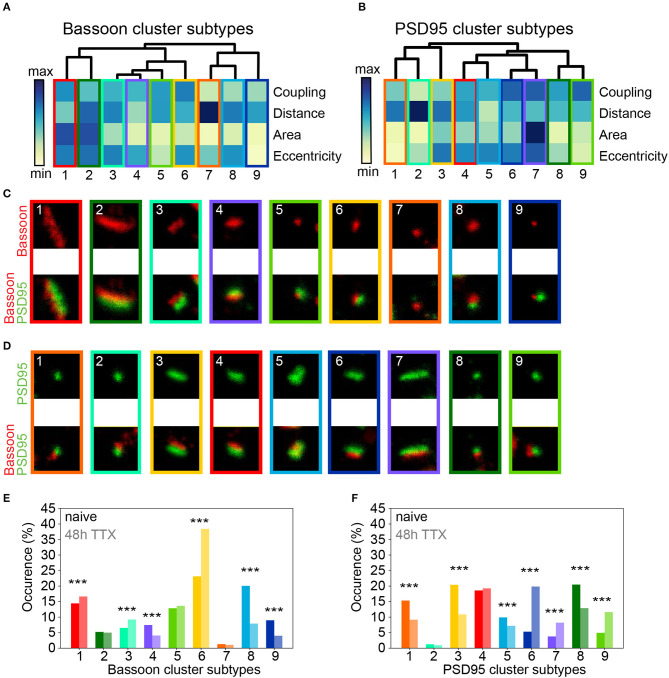
Chronic TTX treatment modifies the prevalence of synaptic cluster morphology and organization. (A,B) Hierarchical grouping of presynaptic Bassoon (A) or postsynaptic PSD95 (B) synaptic subtypes for 4 selected features (hierarchical grouping including all features are shown in Supplementary Figures 26, 27). Synaptic subtypes were identified from the detected local maxima in the KDE plots generated from the scatterplot of the UMAP embedding of all detected Bassoon and PSD95 clusters (Figure 6 and Supplementary Figure 23). Minimum (yellow) and maximum (dark blue) value of the heatmap for each feature: coupling probability (min: 0, max: 1), distance (min: 0 nm, max: 180 nm), area (min: 0.7·10−2 μm2, max: 11.8·10−2 μm2), and eccentricity (min: 0.4, max: 1). (C,D) Representative STED images of (C) Bassoon and (D) PSD95 clusters (top) with corresponding two-color STED image (bottom). (E,F) Proportions of Bassoon (E) and PSD95 (F) clusters belonging to each synaptic subtype depending on the neuronal activity state: naive vs. 48 h TTX. Stars represent significant activity-dependent changes in the proportion of each synaptic type using a Chi-square test. Exact p-values are reported in Supplementary Tables 6, 8 with *p < 0.05, **p < 0.01, and ***p < 0.001. Image size: 0.96 μm2.

