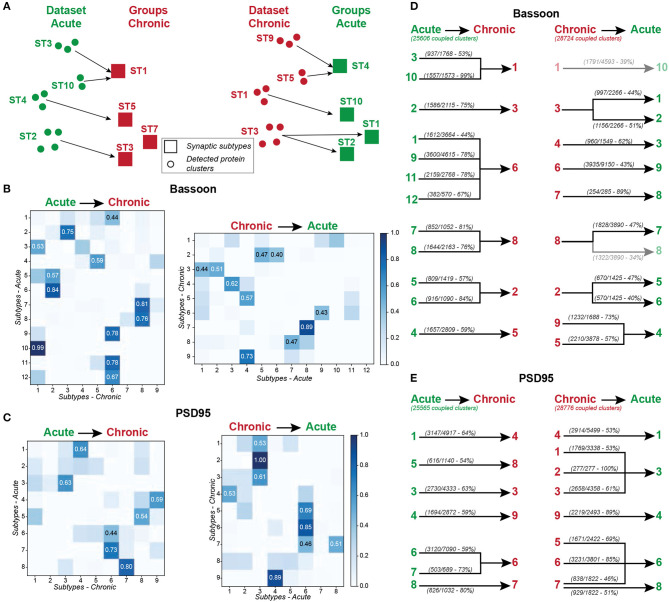
Figure 8.
Mapping the synaptic subtypes that emerged from the acute and chronic treatments. (A) Schematic representation of the mapping approach. Each detected protein cluster of the acute treatment experiments (Dataset Acute, green circles) is assigned to the most similar (smallest Euclidean distance) synaptic subtype of the chronic treatment experiment (Groups Chronic, red squares) and vice versa. (B,C) Results of the mapping analysis, showing the percentage of clusters for Bassooon (B) and PSD95 (C) from each subtypes of one experiment (y- axis, Acute: left, Chronic: right) that are assigned to each subtype of the other experiment (x-axis, Chronic: left, Acute: right). The most prominent association (proportion above 0.4) between groups are highlighted. (D,E) Results of the mapping experiments for Bassoon (D) and PSD95 (E) showing all projections for which more than 40% of the protein clusters belonging to one synaptic subtype of the acute (left) or chronic (right) treatment experiment where mapped into a specific subtype of the other experiment (Chronic: left, Acute: right). The majority of the synaptic subtypes of one experiment exhibit one major connection (more than 40% of the protein clusters are associated) to one group of the other experiment.

