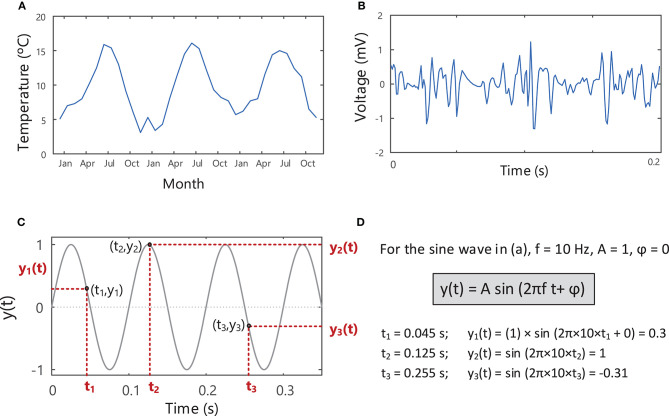
Figure 3.
Signals describing the variation of a measurable quantity over time, e.g., (A) temperature and (B) voltage. (C) A sine wave with an amplitude of 1, frequency of 10 Hz and phase of zero, showing the variation in the signal over time. The instantaneous value of the sine wave, y(t), shown in (C) can be found at each point in time, t, using the equation in (D). See Example (i) in Tutorial Code.

