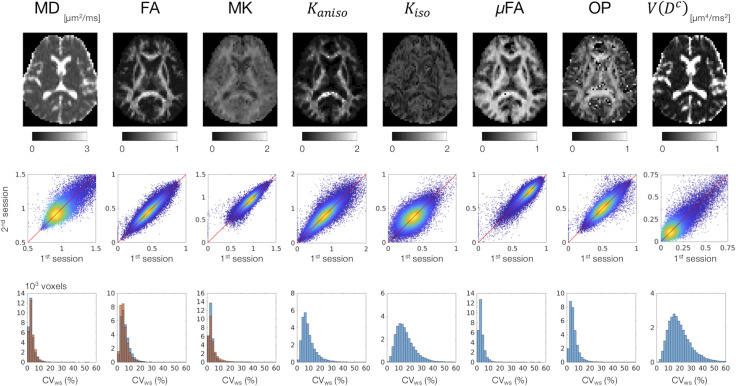
FIGURE 2.
Scan–rescan repeatability of the dMRI parameters derived from DDE. Top: the diffusion parameter maps from a representative subject. Middle: scatterplots comparing the first and the second sessions. Values from the white-matter voxels of all 4 subjects are shown. Warmer color represents higher density of that point. Bottom: within-subject coefficient of variation (CVws) in the white-matter voxels. The blue and orange histograms represent CVws of the dMRI parameters derived from DDE and SDE, respectively.

