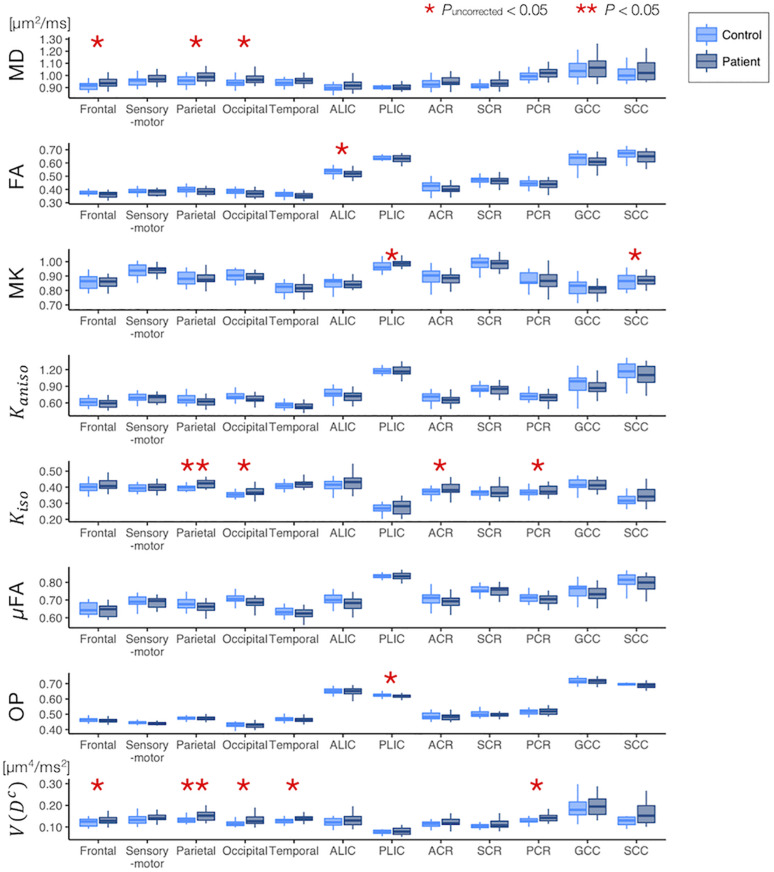
FIGURE 6.
Differences between the healthy control subjects (light blue) and the patients with PD (dark blue) in the ROI-based analyses. The red asterisks denote statistically significant differences (*Puncorrected < 0.05, **P < 0.05). ACR/SCR/PCR, anterior/superior/posterior corona radiata; ALIC/PLIC, anterior/posterior limb of the internal capsule; GCC/SCC, genu/splenium of the corpus callosum.

