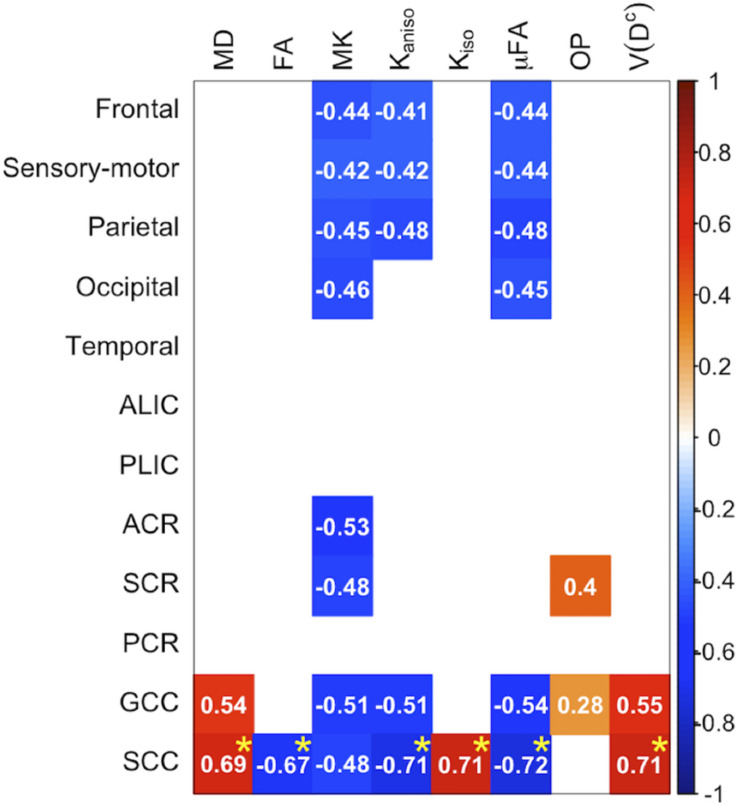
FIGURE 8.
Correlation with UPDRS-III score in the patients with PD. The Pearson correlation coefficients shown indicate significant correlation between a diffusion parameter and UPDRS-III score (Puncorrected < 0.05). Red denotes positive correlations; blue indicates negative correlations. Asterisks indicate significant correlations after FWE correction. ACR/SCR/PCR, anterior/superior/posterior corona radiata; ALIC/PLIC, anterior/posterior limb of the internal capsule; GCC/SCC, genu/splenium of the corpus callosum.

