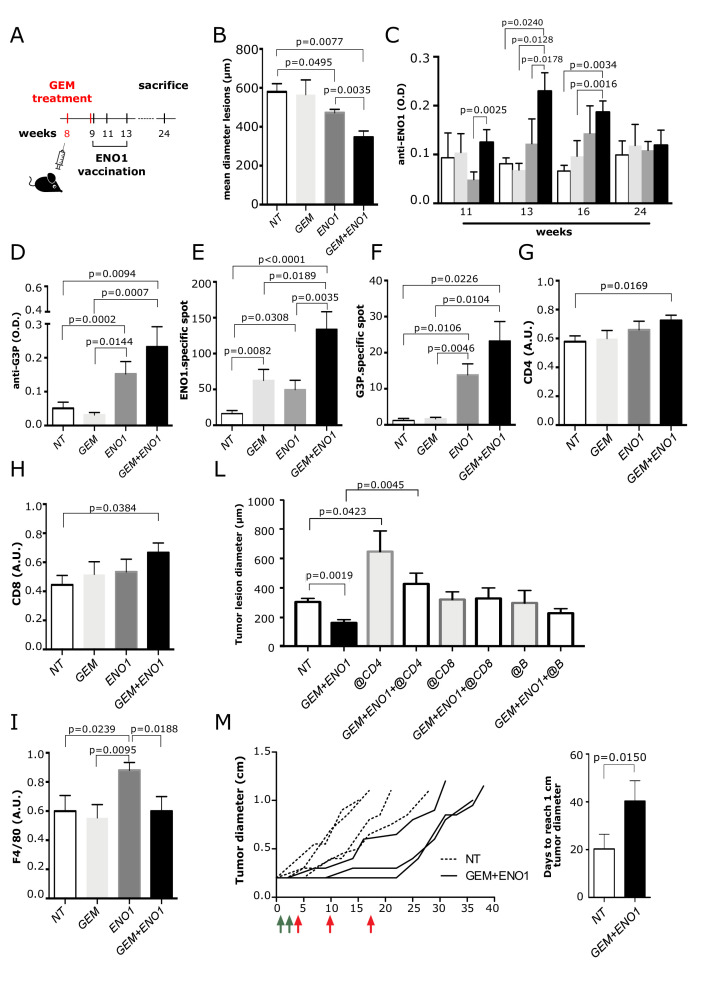
Figure 4.
Effect of combination of GEM and ENO1 vaccination in KC mice. (A) Schematic representation of mice treatment schedule. (B) Evaluation of the mean of tumor lesion diameter in treated mice sacrificed at 24 weeks of age. (C) ELISA detection of anti-ENO1 IgG titer (referred to as OD) in sera of mice throughout the treatment period. The experimental groups are indicated as follows: untreated (NT, white bars), GEM (light gray bars), ENO1 (dark gray) and GEM+ENO1 (black bars). (D) ELISA detection of anti-G3P IgG antibody (referred to as OD) in mice at 16 weeks of age. (E, F) ELISpot analysis of IFN-γ-secreting cells (indicated as number of specific spots) in the different treated groups at sacrifice after restimulation with ENO1 (E) or G3P (F) recombinant protein. (G–I) Immunohistochemical staining of CD4 (G), CD8 (H) and macrophages (I) in tumor lesions of mice at sacrifice. (L) Effect of the depletion of CD4, CD8 and B subsets in GEM+ENO1 or untreated mice, evaluated as the mean of tumor lesion diameter. (M) The spaghetti plot indicates the effect of combined treatment (GEM, green arrows; ENO1 vaccination, red arrows) on tumor growth, measured as tumor diameter. Treatment started when the mass of K8484 tumor cells injected subcutaneously reached 0.2 cm in diameter. The bar graph indicated the days required by the tumor mass to reach 1.0 cm of diameter in control and GEM+ENO1 experimental groups. In all experiments, the mice number per group was between 5 and 11; graphs report the mean±SEM values and statistical significance is shown. GEM, gemcitabine; OD, optical density.

