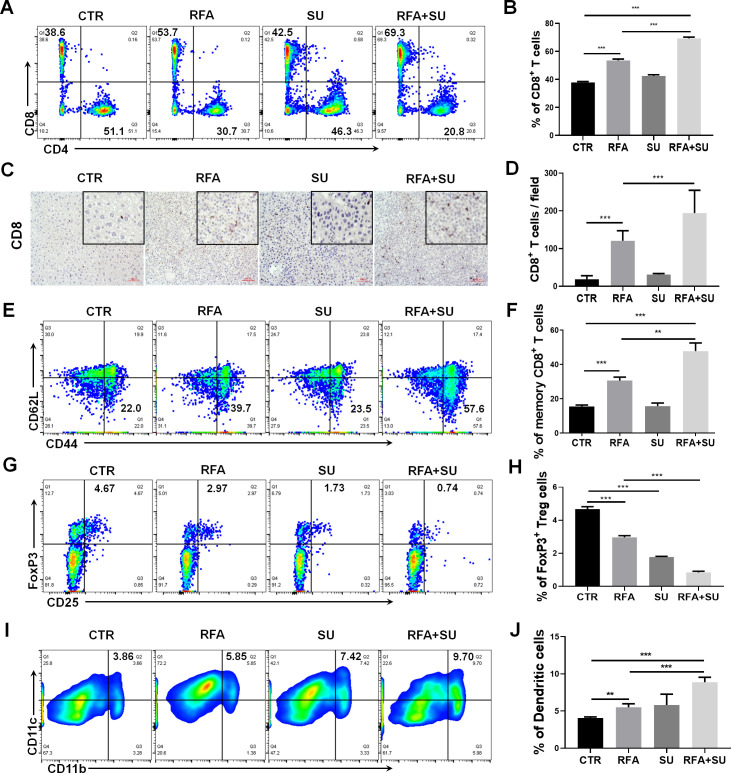
Figure 3.
Sunitinib in combination with RFA changed the profile of tumor-infiltrating immune cells in hepatocellular cancer–bearing mice. Mice with size-matched tumors were randomly distributed into four groups and respectively received no treatment (CTR), RFA monotherapy (RFA), sunitinib monotherapy (SU), and combinational treatment with RFA and sunitinib (RFA+SU) as described in figure 2A. Two weeks post-RFA treatment, tumor-infiltrating leukocytes were isolated and used to conduct flow cytometry. (A) Representative flow cytometric assay to show the frequency of tumor-infiltrating CD8+ T cells in each mouse with the different treatments. (B) The cumulative frequency of tumor-infiltrating CD8+ T cells in each group, n=4, ***p<0.001, error bars represent means±SD. (C) Representative immunohistochemistry (IHC) to show the tumor-infiltrating CD8+ T cells. (D) The cumulative frequency of tumor-infiltrating CD8+ T cells detected by IHC in each group, n=4, ***p<0.001, error bars represent means±SD. (E) Representative flow cytometric assay to show the frequency of memory CD8+ T cells in spleen. (F) The cumulative frequency of memory CD8+ T cells in spleen in different groups of mice. n=4, **p<0.01, ***p<0.001, error bars represent means±SD. (G) Representative flow cytometric assay to show the frequency of tumor-infiltrating FoxP3+ Treg cells in different groups of mice. (H) The cumulative frequency of tumor infiltrating FoxP3+ Treg cells in different groups of mice. n=4, ***p<0.001, error bars represent means±SD. (I) Representative flow cytometric assay to show the frequency of tumor-infiltrating dendritic cells (DCs) (CD11b+ CD11c+) in each mouse with the different treatments. (J) The cumulative frequency of tumor-infiltrating DCs in each group, n=4, **p<0.01, ***p<0.001, error bars represent means±SD. Statistical analysis was performed by Student t-test.

