Figure 6.
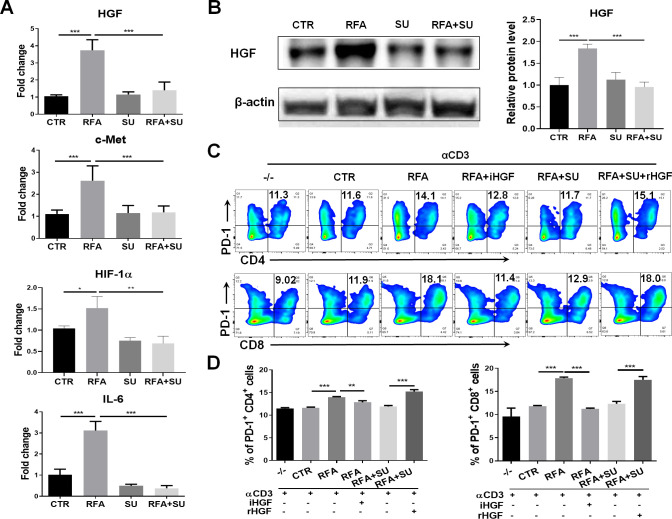
Sunitinib (SU) treatment repressed RFA–induced PD-1 upregulation via HGF signaling. Mice with size-matched tumors were randomly distributed into four groups and received the indicated treatments as described in figure 4. Two weeks post-RFA, tumors were harvested from each mouse and used for the following studies. (A) The gene expression of HGF, c-Met, HIF-1, and IL-6 in the tumors. Total RNAs were extracted from part of tumors in the different groups of mice. qPCR was used to detect the mRNA expression of HGF, c-Met, HIF-1, and IL-6. n=4, *p<0.05, **p<0.01, ***p<0.001, error bars represent means±SD. (B) HGF protein expression in the tumors. Tumor lysate was prepared and used to detect HGF protein expression by western blotting. The protein quantification assay was conducted with ImageJ. n=4, ***p<0.001, error bars represent means±SD. (C) Expression of PD-1 in CD4+ and CD8+ T cells in response to the different stimulation. The splenocytes from wild-type mice were stimulated with the basal level anti-CD3 Ab and the tumor lysate from the mice with the different treatments. Flow cytometry was used to detect PD-1 expression in CD4+ and CD8+ T cells. iHGF, HGF inhibitor; rHGF, recombinant HGF; TL-CTR, tumor lysate from the control mice without treatment; TL-RFA, tumor lysate from the mice with RFA monotherapy; TL-RFA+SU, tumor lysate from the mice with combined treatment with SU and RFA. (D) Average frequencies of PD-1+CD4+ T cells and PD-1+CD8+ T cells. n=3, **p<0.01, ***p<0.001, error bars represent means±SD. Statistical analysis was performed by Student t-test.

