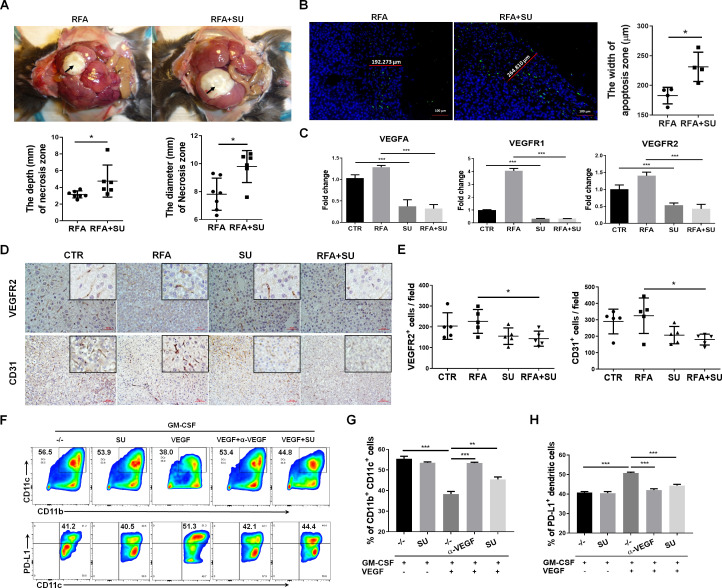
Figure 7.
Sunitinib (SU) blocks VEGF signaling pathways to activate dendritic cells (DCs), suppress vascularization, and enhance radiofrequency-mediated tumor ablation. Mice with size-matched tumors were randomly exposed to no treatment (control), SU, RFA, or both. One week post-RFA, the mice were euthanized for the following studies. (A) SU treatment enlarged RFA-induced tumor ablation. Upper panel: representative macroscopic examination of the damaged tumors; lower panel: the accumulated depth and the diameter of RFA-induced tumor necrosis zone. n=7 in RFA group, n=6 in RFA+SU group, *p<0.05, error bars represent means±SD. (B) RFA-induced tumor apoptosis. Representative images to show RFA-induced tumor cell apoptosis in the mice treated with RFA or SU/RFA. Green color shows the apoptotic area surrounding the ablated tumor zone; blue color shows the DAPI-stained nuclei; red lines show the width of apoptotic tumors in the different mice. Accumulated width of apoptotic tumors in the indicated mice is shown. n=4, *p<0.05, error bars represent means±SD. (C) mRNA expression of VEGF signaling molecules. qPCR detected the mRNA expression of VEGF, VEGFR1, and VEGFR2 in the tumors from the mice under the different treatments. n=4, *p<0.05, **p<0.01, ***p<0.001, error bars represent means±SD. (D) Protein expression of VEGFR2 and CD31. Representative images of immunohistochemistry staining for VEGFR2 and CD31 in the tumors in the mice with the indicated treatments. (E) Accumulative results to show the numbers of VEGFR2-positive and CD31-positive cells in each field. n=5, *p<0.05, error bars represent means±SD. Statistical analysis was performed by Student t-test. (F) Representative flow cytometric assay for DC differentiation and PD-L1 expression. Bone marrow cells in C57BL/6 mice were stimulated with GM-CSFs in the presence of SU, VEGF, anti-VEGF antibodies, or indicated combination. Seven days later, the suspended cells were harvested. After staining for CD11b, CD11c, and PD-L1, the cells underwent flow cytometric assay. (G) Mean frequencies of CD11b+CD11c+ DCs. n=3, **p<0.01, ***p<0.001, error bars represent means±SD. (H) Mean frequencies of PD-L1+ DCs. n=3, ***p<0.001, error bars represent means±SD. Statistical analysis was performed by Student t-test.

