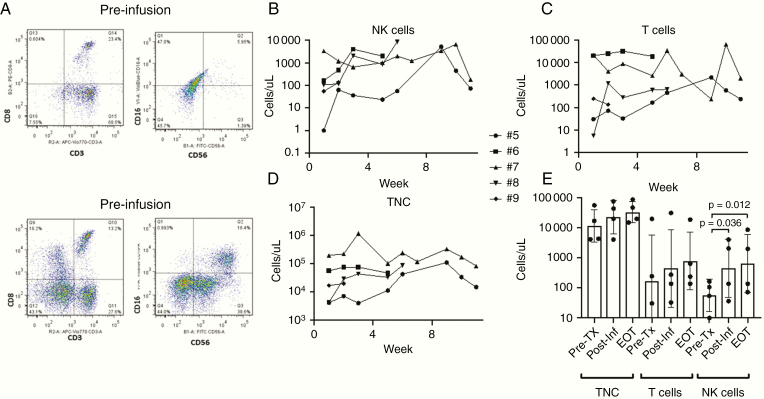
Fig. 3.
Flow cytometric assessment of CSF cell infiltrates shows total NK cells are increased acutely and sustained during the treatment period. CSF was stained for surface markers and analyzed as described (gating strategy shown in Supplementary Figure 3) and cell concentrations determined based on TNCs and percentage of subsets. Shown are results for all patients treated after dose-escalating to once-weekly infusions. (A) Representative flow plots from pretreatment (drawn prior to first infusion) and posttreatment (drawn prior to second treatment) samples. (B) NK-cell (CD3-CD16or56+) content, (C) T cell (CD3+) content, and (D) TNC content during the treatment period. (E) Comparison of each patient’s TNC, T-cell, and NK-cell content in CSF before any NK cell infusions (Pre-Tx), after the first infusion (Post-Inf), and at the end of protocol therapy (EOT). Shown are P-values that are <0.05 for ratio paired t-test.

