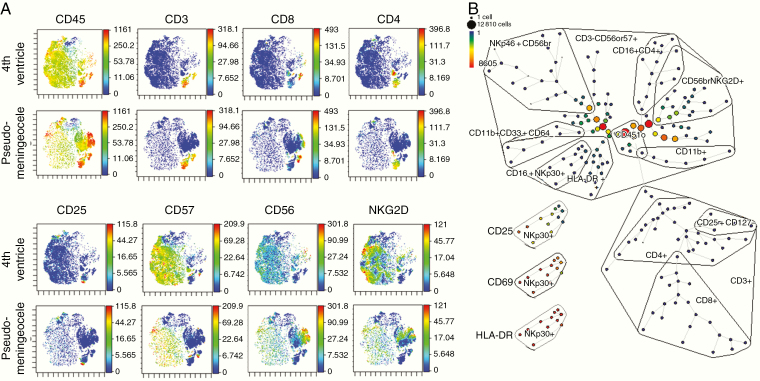
Fig. 4.
Mass cytometry shows phenotypes of NK cells persistent locoregionally in the fourth ventricle and those migrating to a pseudomeningocele. Analysis of CSF samples after gating on nonviable, nondoublet, CD45+ cells. (A) ViSNE plots showing relative expression of common NK cell and T-cell markers. (B) SPADE analysis showing relative content of NK-cell and T-cell subpopulations, with high expression of activation markers CD25, CD69, and HLA-DR shown for the CD16+NKp30 subset.

