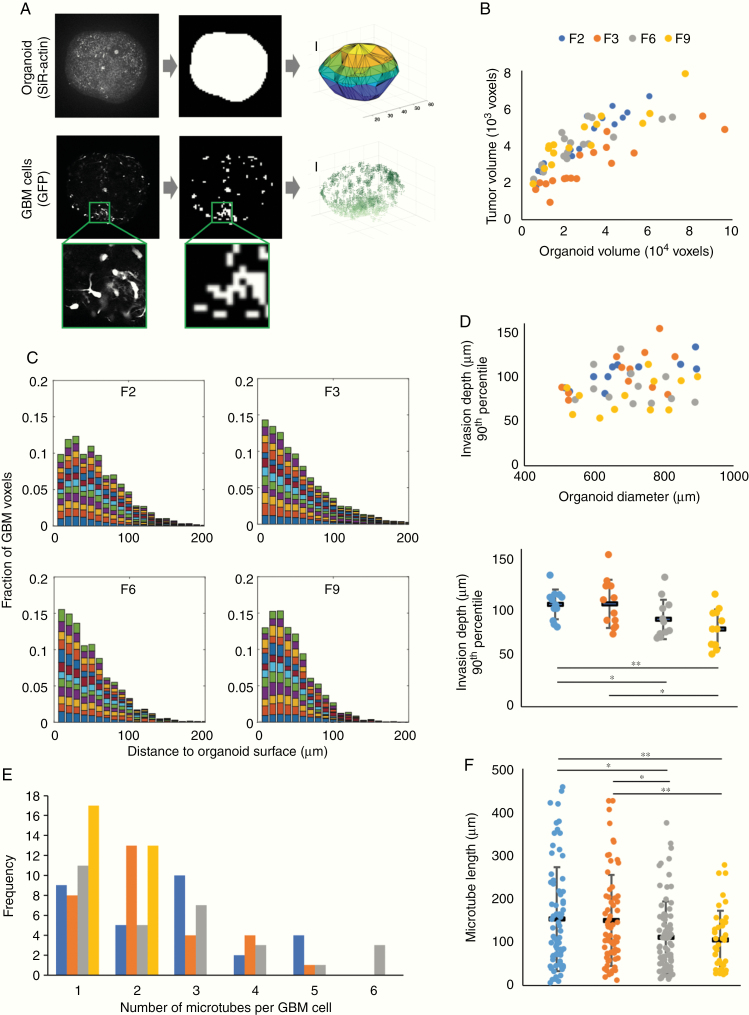
Figure 2.
Morphological features of patient-derived GBM cells invading organoids. (A) Image analysis workflow. To approximate the organoid surface, organoids were incubated with the live dye SiR-actin; following fixation and clearing, the actin signal was binarized and triangulated (top). Above-threshold GFP signal was used as a proxy for GBM cell location (bottom). Scale bars, 100 µm. (B) Total tumor cell volume as a function of organoid volume. (C) Distributions of distances of tumor voxels from the organoid surface of 12 organoids from each patient cell line with 500–900 µm diameter; each color represents one organoid. (D) Invasion depth of the most invasive cells from each cell line (90th percentile) compared with organoid size (top) and differences in invasion depth between patient cell lines (bottom; *P < 0.05, **P < 0.01, two-sided Student’s t-test). (E) Number of tumor microtubes per cell observed across 30 GBM cells from each patient. (F) Microtube lengths ranged up to almost 450 µm, with GBM cells from patients F2 and F3 developing longer microtubes than cells from patients F6 and F9 (*P < 0.05, **P < 0.01, two-sided Student’s t-test). In (D) and (F), black horizontal bars indicate mean values and error bars represent standard errors in the mean.

