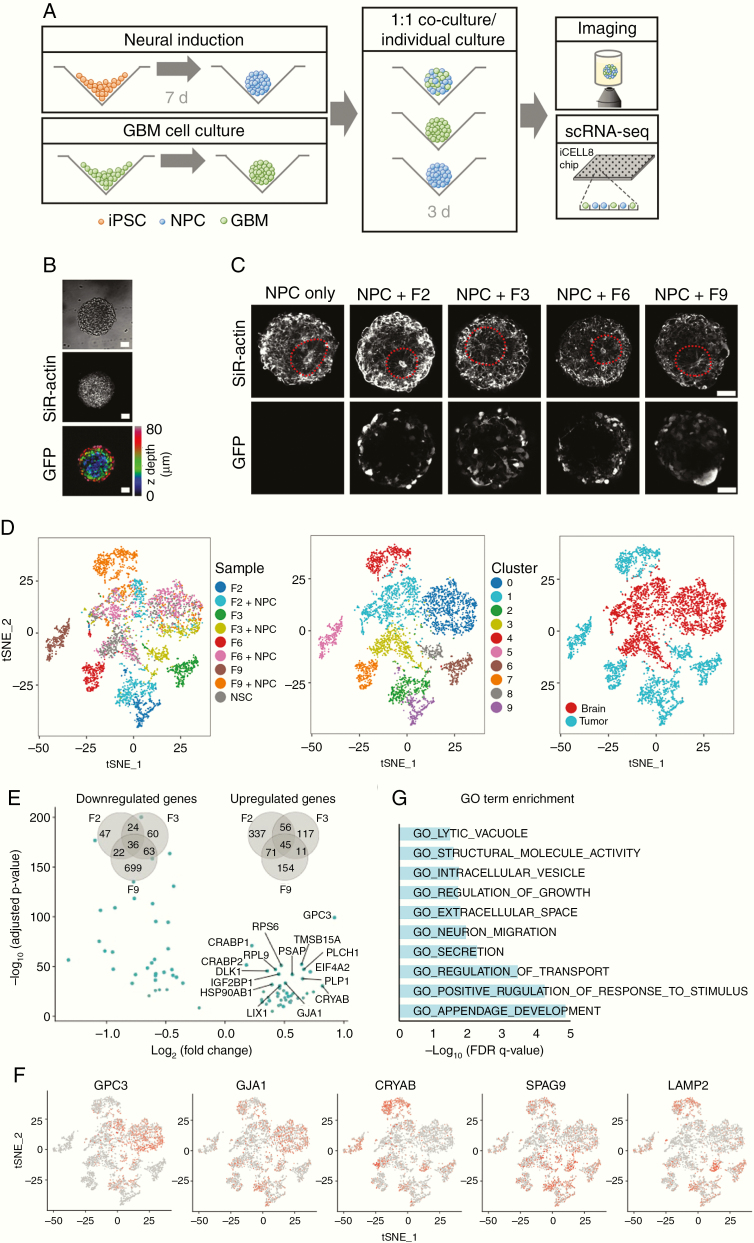
Figure 3.
Single-cell RNA-seq analysis of GBM cell interactions with cerebral organoid cells. (A) Protocol for the RNA-seq experiments. Following 7 days of neural induction, organoids and spheroids of lentivirally labeled GBM cells grown separately were enzymatically dissociated and mixed at a 1:1 ratio. After 3 days of co-culture, mixed spheroids were subjected to imaging or scRNA-seq using the iCell8 system. (B) Tumor cells mixed efficiently with organoid cells (see also Supplementary Figure 4). Scale bars, 50 µm. (C) With or without addition of GBM cells, dissociated organoid cells reestablished the characteristic 3D architecture of neural rosettes within 3 days. Scale bars, 50 µm. (D) t-SNE map showing all cells after quality control and PCA-based clustering, colored by sample origin (left), by cluster (middle), and by organoid or tumor cell identity (right). In addition to 3 clusters containing organoid cells, GBM cells clustered separately for each patient and before or after co-culture with organoid cells. (E) Volcano plot shows the 45 genes significantly up- or downregulated across all 3 patient-derived GBM cell lines upon co-culture with organoid cells (adjusted P < 0.05 for each patient separately). Venn diagrams quantify the overlap of differentially regulated genes detected from each patient. (F) Expression of differentially regulated genes visualized on a t-SNE map of all cells (t-SNE representation identical to panel D). (G) Gene Ontology–based gene set enrichment analysis of genes upregulated in all patient tumor cell lines upon co-culture with organoid cells.

