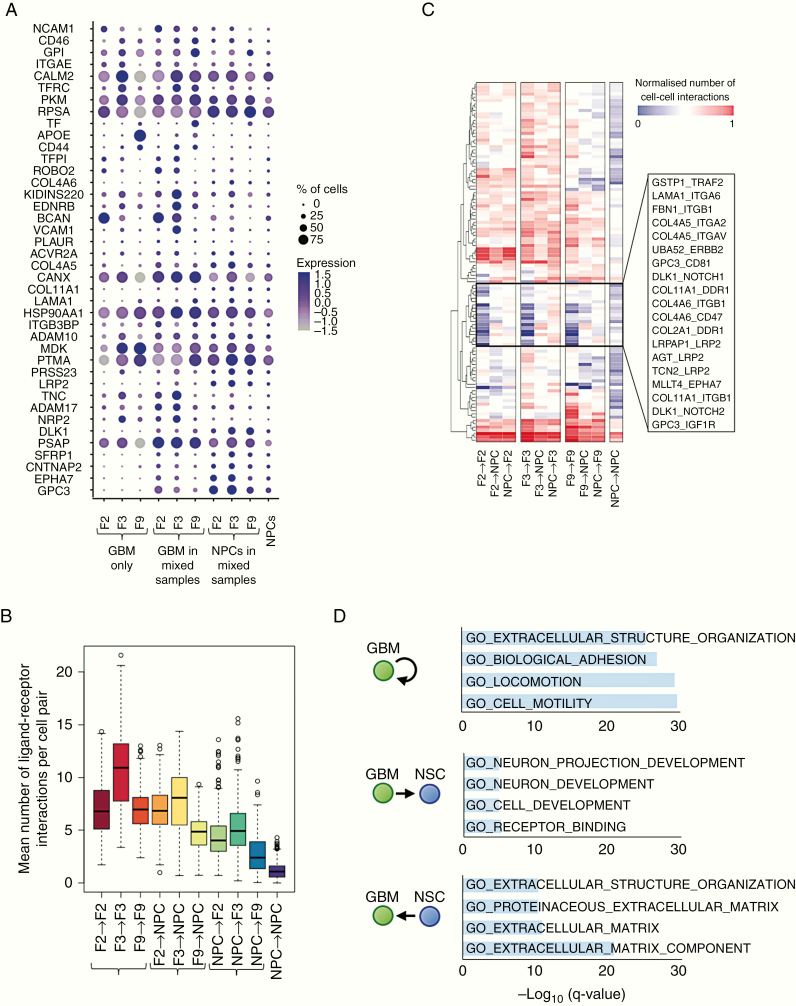
Figure 4.
Potential ligand–receptor interactions between GBM and organoid cells. (A) Expression of ligand and receptor genes that are significantly upregulated in NPCs or in at least one GBM cell line upon co-culture (adjusted P < 0.05), averaged across GBM-only samples (left), GBM cells, or NPCs within mixed samples (middle), and the NPCs-only sample (right). Dot size corresponds to the fraction of cells expressing the gene in each group; dot color represents the average expression level. (B) The mean number of ligand–receptor pairs potentially connecting cells pairs of the given cell types, based on RNA expression levels across GBM-only samples (left), GBM cells, or NPCs within mixed samples (middle), and the NPCs-only sample (right). Center line, median; box limits, upper and lower quartiles; whiskers, 1.5x interquartile range; points, outliers. (C) Mean number of cell-cell interactions for different cell type combinations and selected ligand–receptor pairs. Hierarchical clustering reveals a group of ligand–receptor pairs (middle box) that are expressed at low levels in GBM cells or NPCs alone, but are upregulated upon co-culture. (D) Gene Ontology–based gene set enrichment analysis of ligand–receptor pairs preferentially expressed in the given cell type combinations.

