Fig. 5.
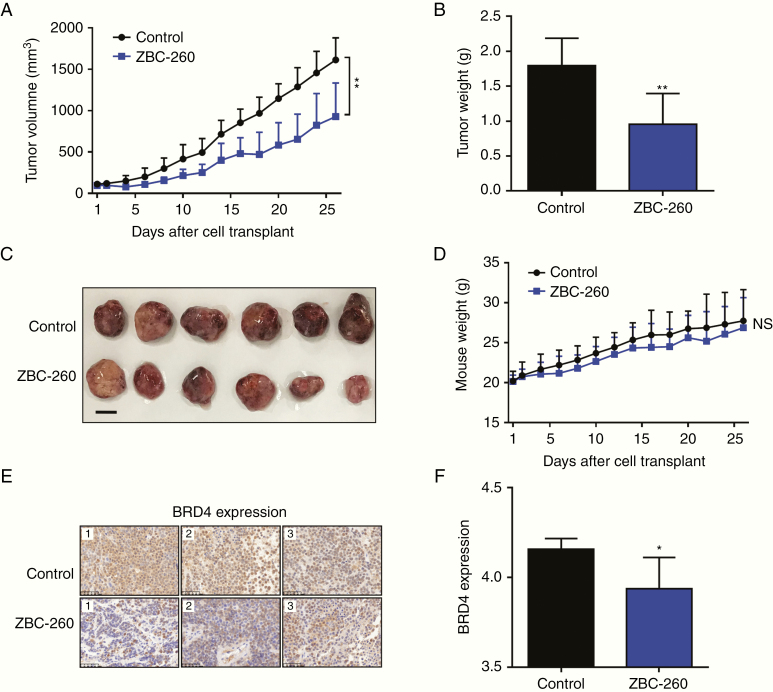
The BRD4 inhibitor suppressed tumor growth in subcutaneous PA models. (A) Tumor volume of mice treated with ZBC-260 (2.5 mg/kg) or vehicle control once daily, measured for 26 days. (B) Histogram of the tumor weight. (C) Macroscopic image of the resected tumor. Scale bar: 1 cm. (D) Mice weight measured for 26 days. (E) Representative IHC images of BRD4 expression in resected tumor tissues. Scale bars: 50 μm. (F) Logarithmized IOD value of BRD4 expression in IHC images. Each column represents a different sample. *P < 0.05; **P < 0.01. Bar represents mean ± SD.

