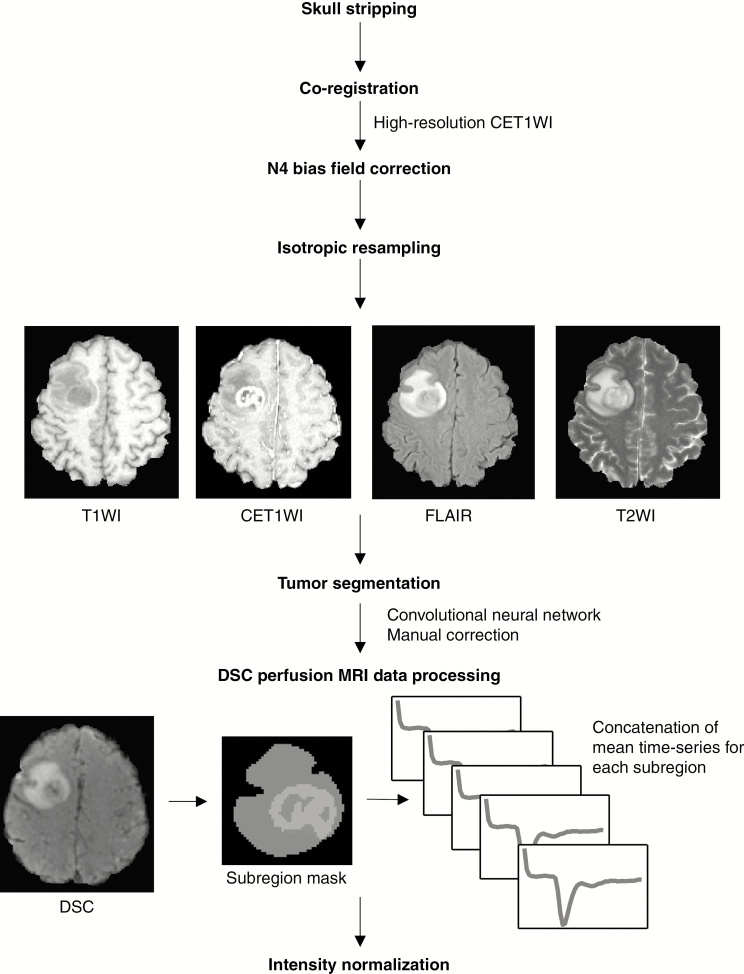
Fig. 1.
MRI preprocessing pipeline. All the conventional MRI data were skull stripped, co-registered, and resampled. They were then submitted to tumor segmentation using convolutional neural networks with manual correction. The raw T2* signal intensity-time curve was obtained from DSC perfusion MRI using the subregion mask: peritumoral edema (blue), enhancing tumor core (green), and non-enhancing tumor core (red).

