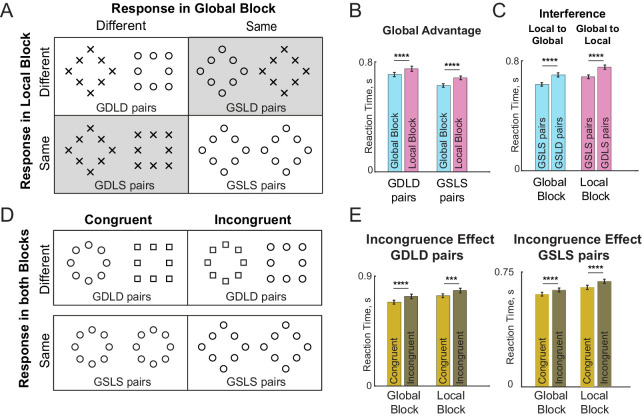
Figure 2.
Same-different task for global-local processing. In the global block, participants had to indicate if a pair of images presented contain the same shape at the global level. Likewise, in the local block, they had to make same-different judgments about the shape at the local level. Block order was counterbalanced across participants. (A) Example image pairs from four image-pair types with its response in global and local block (GSLS = global same local same; GDLD = global different local different, etc.). Image pairs with identical response in both blocks are shown on a white background and pairs with opposite responses in the two blocks are shown on a grey background. (B) Average response times for GDLD and GSLS pairs in the global and local blocks. Error bars indicate SEM of average response times across participants. Asterisks indicate statistical significance of the main effect of interference in a linear mixed effects model on inverse response times (**** indicates p < 0.00005; see text for details). (C) Global-local Interference effects. Left: Average response times comparing GSLS (n = 49) and GSLD (n = 147) pairs in the global block, measuring how the presence of a local shape difference interferes with the SAME response. Right: Average response times comparing GSLS (n = 49) and GDLS (n = 147) pairs in the local block, measuring how the presence of an irrelevant global shape difference interferes with the SAME response. In both panels, asterisks indicate statistical significance (**** indicates p < 0.00005 for main effect of congruence in a linear mixed effects model on inverse response times; see text). (D) Top Row: Example congruent and incongruent image pairs which elicit the DIFFERENT response in both global and local blocks. Bottom row: Example congruent and incongruent pairs that elicit the SAME response in both blocks. (E) Average response times to congruent and incongruent stimuli in both global and local blocks for GDLD pairs (left panel) and GSLS pairs (right panel). Error bars indicate SEM across participants. Asterisks indicate statistical significance using linear mixed effects model on inverse reaction times (**** is p < 0.00005; see text).

