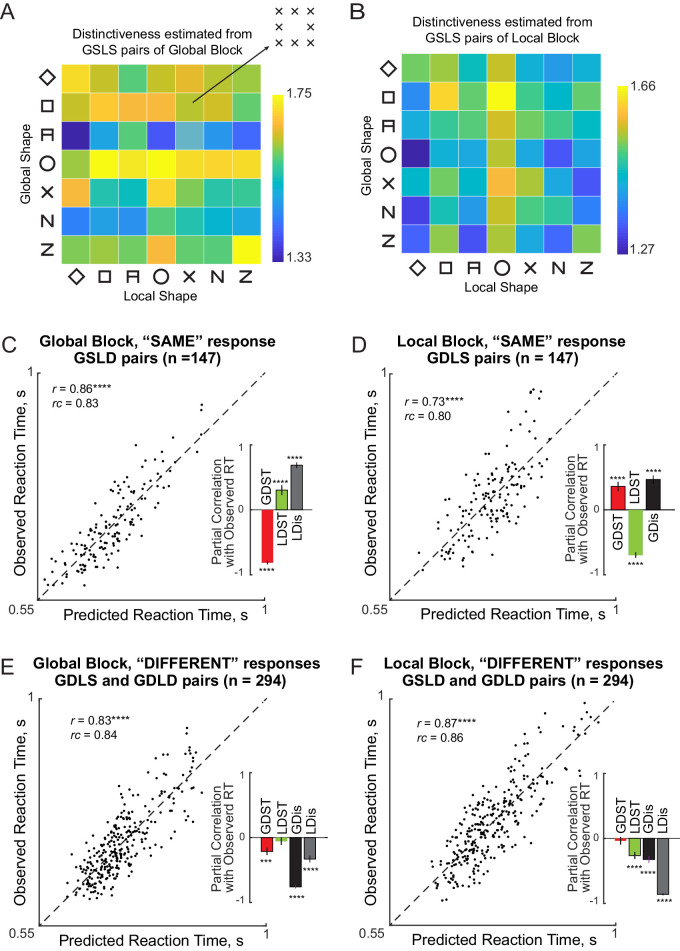
Figure 3.
Quantitative model predictions for the same-different task. (A) Distinctiveness of each hierarchical stimulus estimated using the inverse response times for identical image pairs (GSLS) in the global block. (B) Distinctiveness of each hierarchical stimulus in the local block. (C) Observed versus predicted response times for “SAME” responses in the global block. Inset: Partial correlation between observed response times and each factor while regressing out all other factors (GDST and LDST = global and local distinctiveness; GDis and LDis: global and local dissimilarity). Error bars represents 68% confidence intervals, corresponding to ±1 standard deviation from the mean. (D) Same as C but for “SAME” responses in the local block. (E) Same as C but for “DIFFERENT” responses in the global block. (F) Same as C but for “DIFFERENT” responses in the local block.

