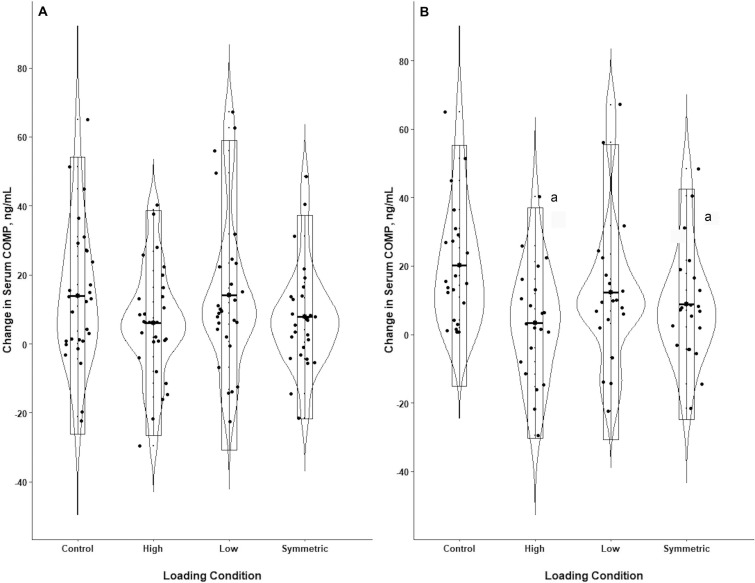
Figure 3.
Changes in serum cartilage oligomeric matrix protein concentration (sCOMP). A, displays the results from the entire cohort of participants (n = 30), whereas B, displays the results from the subgroup of participants who demonstrated increased sCOMP during the control condition (n = 22); data are presented as the mean changes in sCOMP with corresponding SDs. a Indicates smaller increase in sCOMP than in the control condition.

