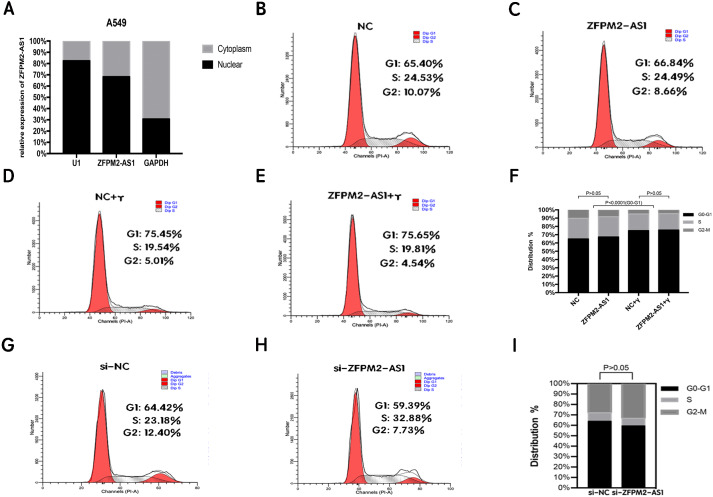
Figure 5. The location and effect on the ZFPM2-AS1 cell cycle.
(A) The ZFPM2-AS1 expression levels in the A549 cell nucleus and cytoplasm fractions were found using qRT-PCR. The statistical Chi-square test was performed with three independent experiments. (B-I) We analyzed the flow cytometric of the cell cycle 24 hrs after ZFPM2-AS1 knockdown or overexpression in the presence or absence of IFN-γ.

