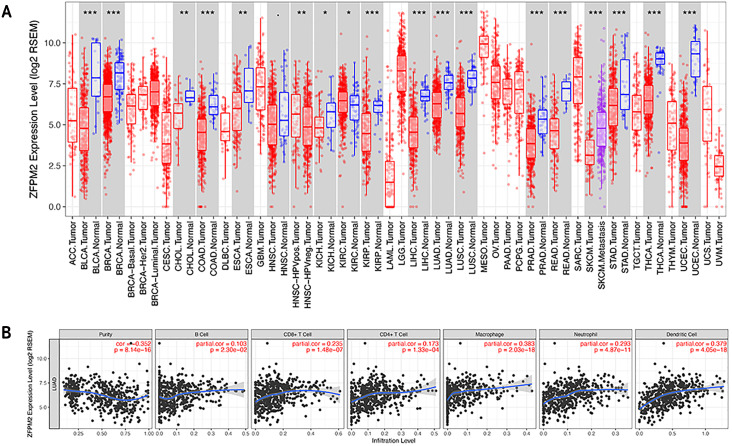
Figure 6. Correlations between ZFPM2 expression and immune infiltration level.
(A) ZFPM2 expression levels of various human tumor types were validated using TIMER (*p<0.05, **p<0.01, ***p<0.001). The color red signified tumor tissues, blue signified normal tissues, and purple signified metastasis tissue. (B) The correlations between ZFPM2 expression and tumor purity, B cells, CD8+ T cells, CD4+ T cells, macrophages, neutrophils, or dendritic cells were analyzed.

